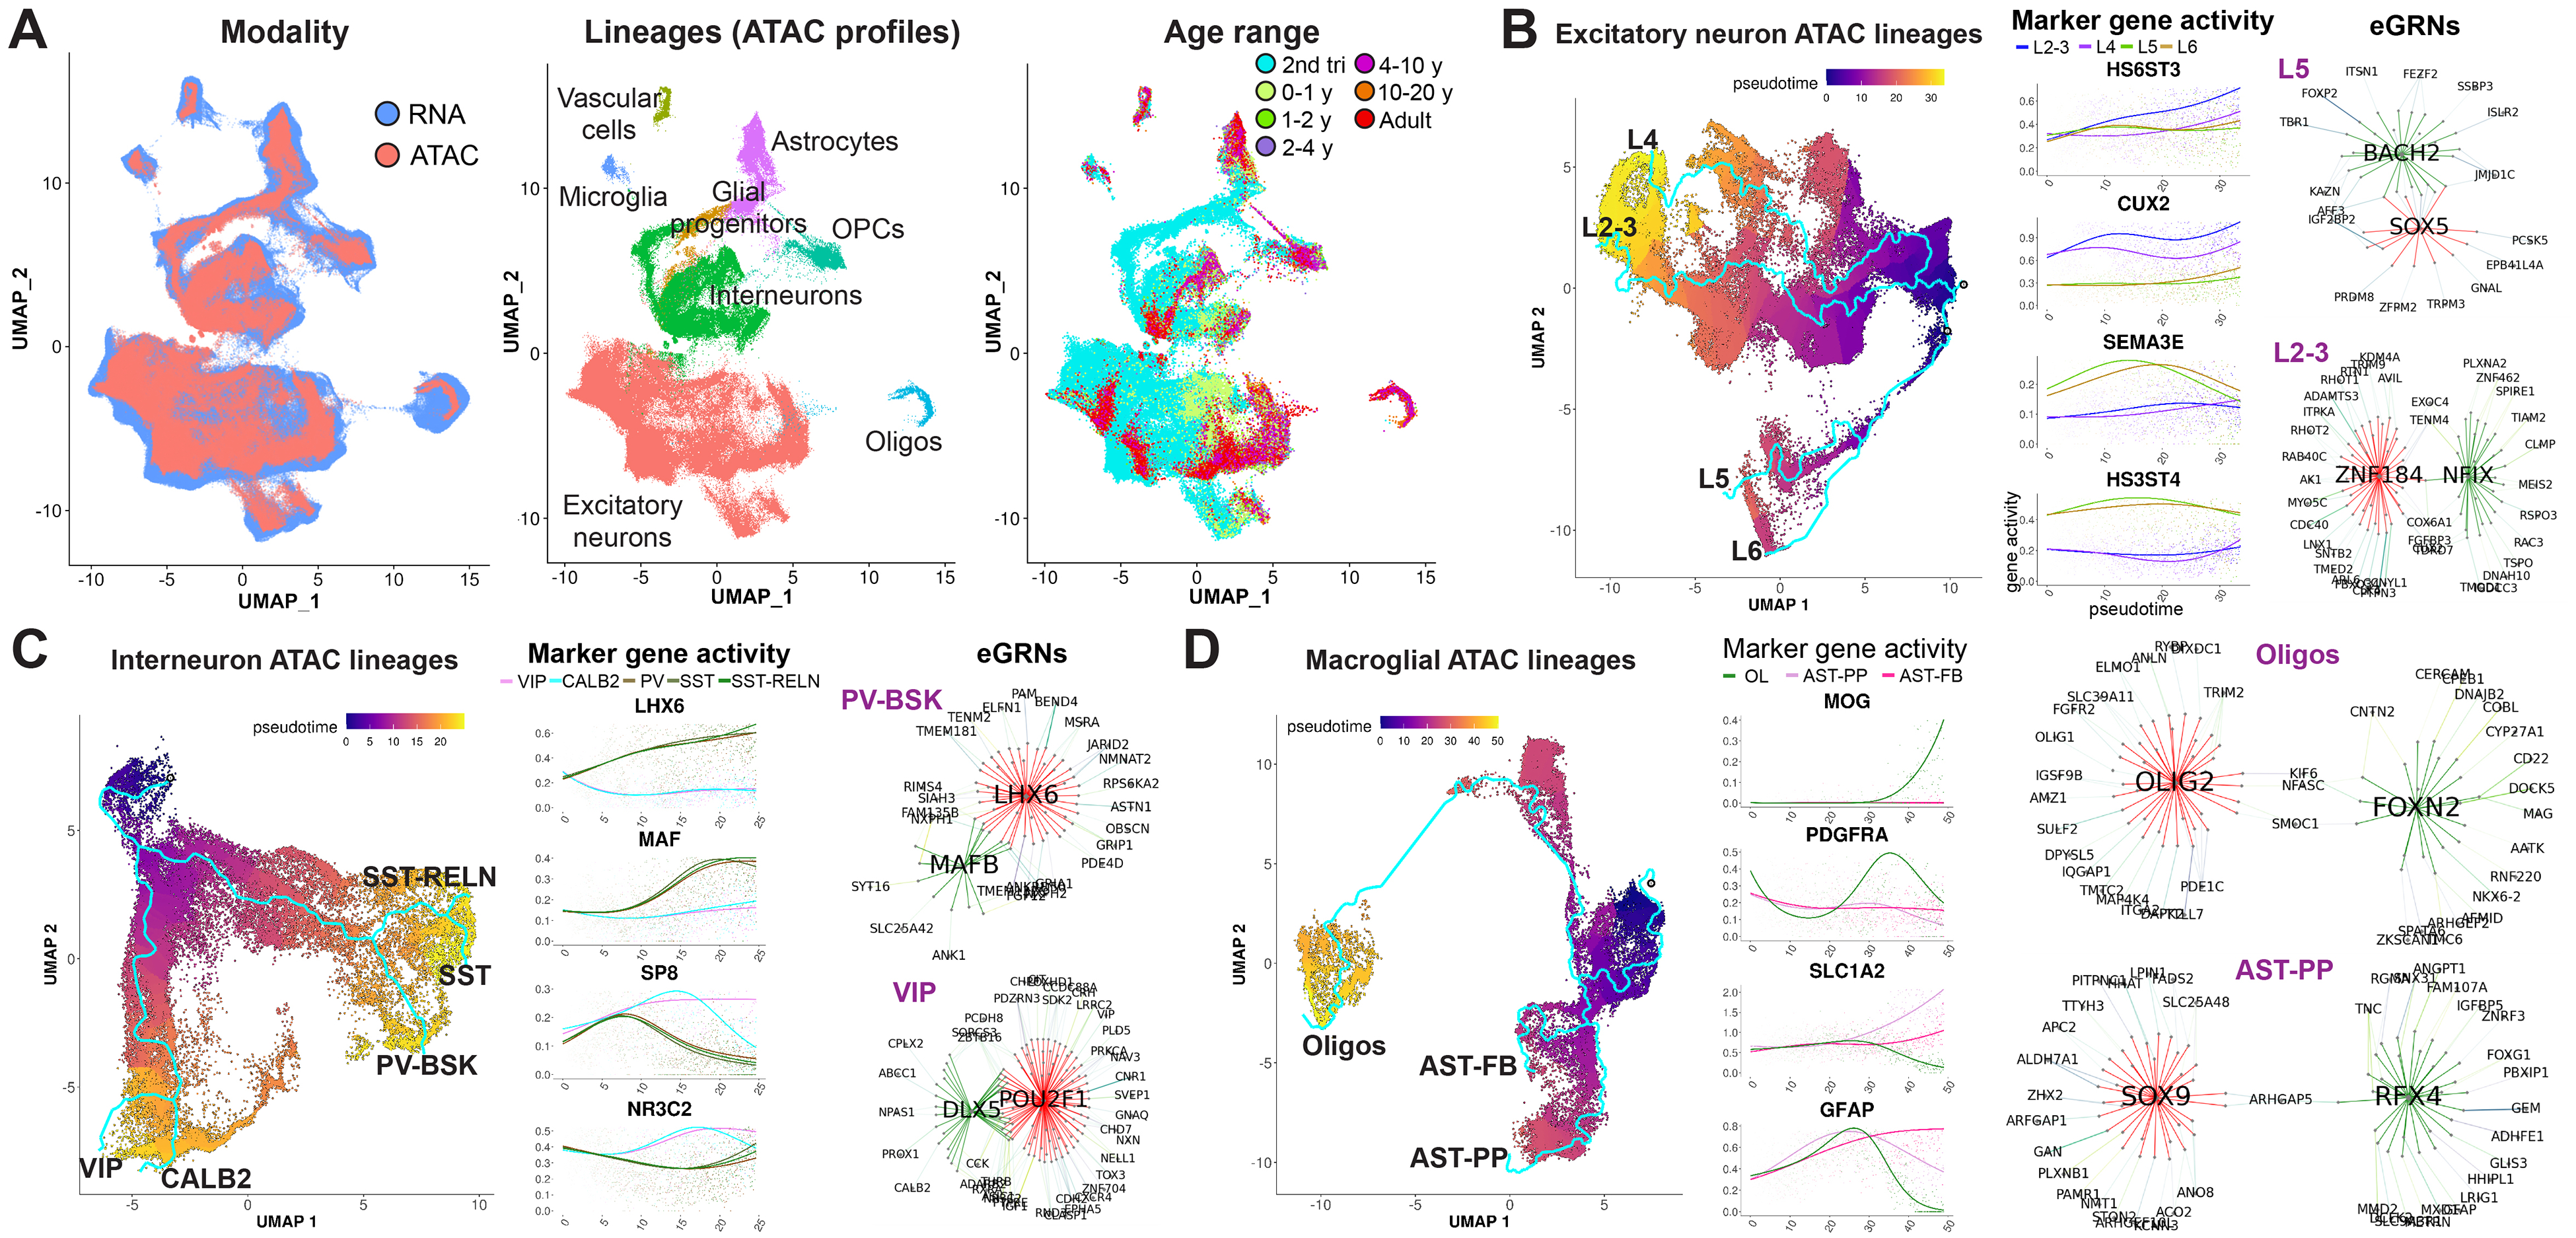
Fig. 4. Identification of lineage-specific epigenetic and transcriptional regulators.

(A) Integration of snRNA-seq and snATAC-seq data. snATAC-seq data was mapped on the snRNA-seq coordinates, clusters, and cell types. (B to D) Analysis of eGRNs in excitatory neuron lineages (B), interneurons (C), and glial lineages (D). Network plots (eGRNs) display transcription factors predicted to bind enhancer regions to regulate lineage-specific transcriptional programs. Edge colors indicate regulation by different transcription factors. Top 20 genes on the basis of the predicted confidence of interaction are shown for each transcription factor network.
