Fig 4.
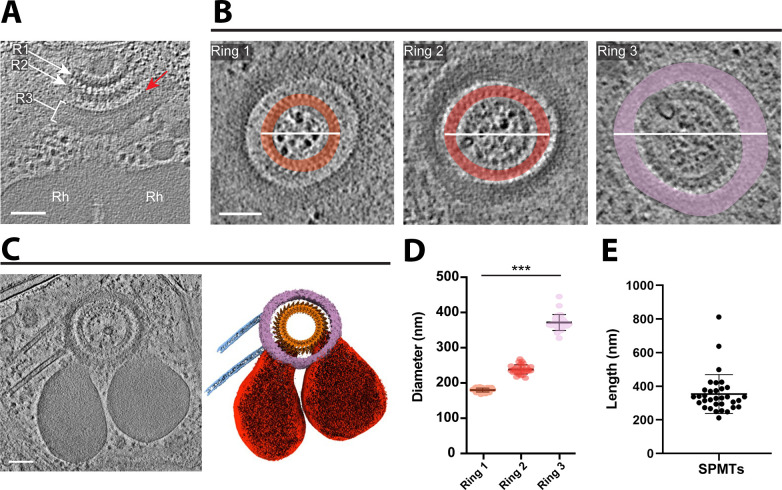
The apical rings appear as three distinct entities. (A) A tomographic slice showing the rhoptries (Rh) and three apical rings (R1, R2, R3). The red arrow points to “bead-like” densities on the innermost edge of Ring 3. Scale bar, 500 nm. (B) Three tomographic slices from a tomogram (different from [A]) showing a top view of the three apical rings, highlighted in different colors (orange, red, and violet for Rings 1, 2, and 3, respectively). The white lines represent the diameter that was measured for (D). Scale bar, 100 nm. (C) The left panel is a tomographic slice showing the rhoptries, three apical rings, the apical vesicle, and two SPMTs. The right panel is the cryo-ET average densities of the three apical rings (orange and purple) and the annotation of SPMTs (blue) and rhoptries (red). Scale bar, 100 nm. (D) The mean maximum diameter for each apical ring. Ring 1 mean ± SD = 180 ± 6 nm, N = 30; Ring 2 mean ± SD = 238 ± 13 nm, N = 30; Ring 3 mean ± SD = 372 ± 23 nm, N = 29. (E) The mean length of associated SPMTs is 354 ± 116 nm, N = 33.

