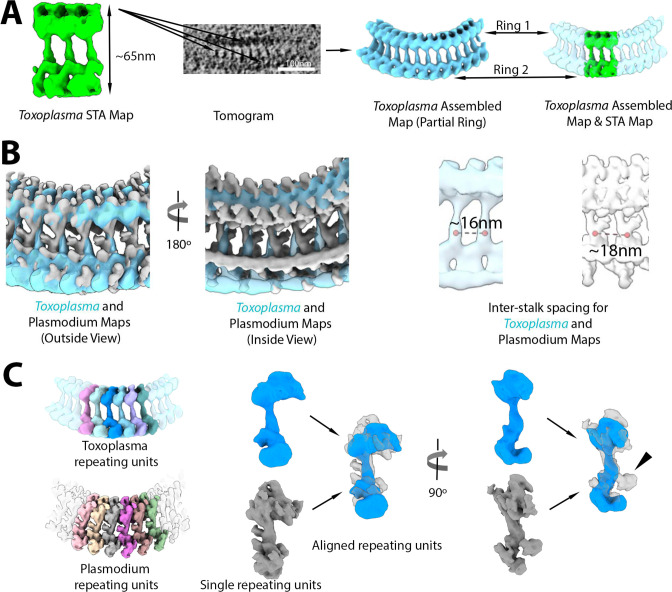
Fig 6.
Plasmodium falciparum Rings 1 and 2 show a similar repeating unit and pattern to those seen for the pre-conoidal rings of Toxoplasma gondii. (A) A subtomogram average map of the Toxoplasma apical rings (green) containing three bridge stalks was generated and mapped back to a tomogram, producing an assembled map (cyan blue). (B) The assembled maps of Toxoplasma (cyan blue) and Plasmodium (gray) viewed from inside and outside the apical rings are superimposed to show similar geometries overall. Note that the spacing of the bridge stalks differs, with ~16 nm for Toxoplasma and ~18 nm for Plasmodium. (C) The repeating units (random colors) in the two assembled maps were segmented in Toxoplasma like in Plasmodium. A single unit from Toxoplasma (blue) and Plasmodium (gray) was superimposed for comparison. Extra density of the bridge stalk can be seen for Plasmodium relative to Toxoplasma (arrowhead).

