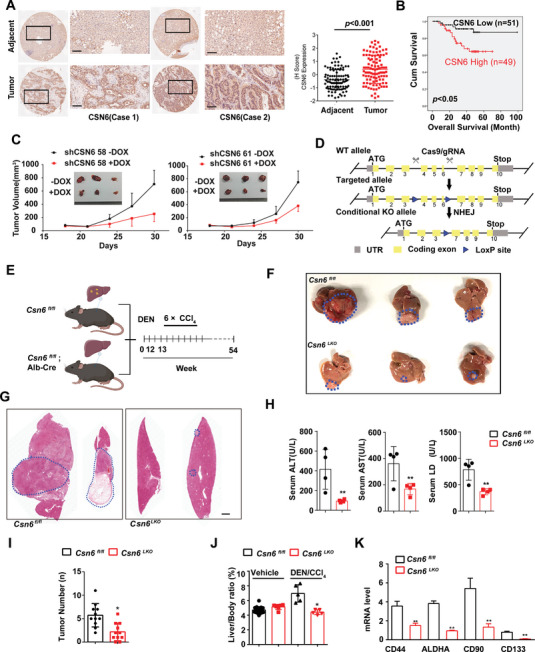
Figure 1.

CSN6 promotes HCC growth and correlates with poor survival. A) Representative image of CSN6 IHC staining in human liver cancer and adjacent normal liver tissue. Scale bars, 100 µm. Quantitative CSN6 expression was shown in paired HCC tissue and adjacent normal tissue (right panel). Data are presented as mean ± SD. B) Kaplan‐Meier survival curves of overall survival duration based on CSN6 expression in human HCC tissue microarray. C) Impact of DOX‐induced shCSN6 on tumor growth of Huh‐7 xenograft tumors. Tumor volume was measured. The data are presented as the means ± s.d. n = 5; **, p < 0.01. D) Schematic depiction of generating Csn6 conditional knockout (KO) mouse model. E) Time line of Alb‐ Cre mediated liver‐specific Csn6 knockout (KO) mouse treated with DEN/CCl4 treatment. Csn6 fl/fl mice (n = 10) and Csn6 LKOmice (CSN6LKO, n = 10) were injected with DEN (100 mg kg−1, i.p.) at the age of 12 weeks followed by six injections of CCl4 (0.5 mL kg−1, i.p.) and sacrificed 12.5 months after DEN. Scale bar, 2 mm. F) Gross morphology of DEN/CCl4‐challenged Csn6 fl/fl and Csn6 LKO mice. G) H&E staining of DEN/CCl4‐challenged Csn6 fl/fl and Csn6 LKO mice. H) Serum level of ALT, AST, and LDH from indicated mice was measured after DEN/CCl4 treatment. **, p < 0.01. I) Tumor number from indicated mice were determined. *, p < 0.05; **, p <0 .01. J) Liver body ratios from indicated mice were determined. *, p < 0.05. K) Liver cancer marker genes were determined by qPCR. n = 3; **, p < 0.01.
