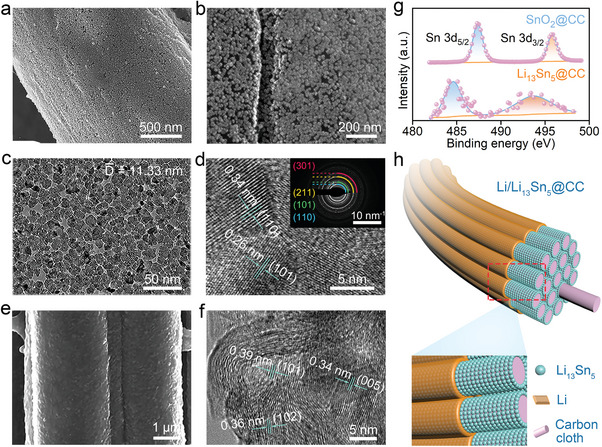
Figure 1.

a) SEM and b) zoomed‐in images of SnO2@CC. c) TEM and d) HRTEM images of SnO2 distributed on CC. Inset is the corresponding SAED pattern. e) SEM and f) HRTEM images of Li13Sn5@CC. g) High‐resolution XPS spectra of Sn 3d for SnO2@CC and Li13Sn5@CC. h) Schematic illustration of Li13Sn5@CC and the associated Li deposition.
