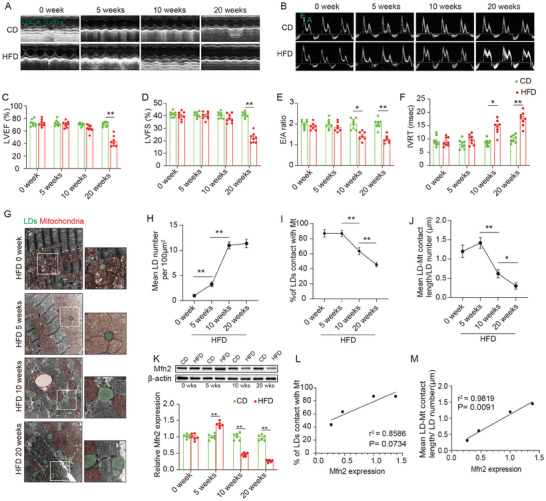
Figure 1.

Lipid accumulation, reduced MLC and decreased Mfn2 expression were observed in the heart of obese mice. A–F) Echocardiographic assessment were performed on CD‐ and HFD‐fed WT mice. n = 8 mice per group. A&B, Representative images of M‐mode echocardiography (A) and representative Doppler flow measurement of mitral inflow (B). C–F, Left ventricle ejection fraction (LVEF), left ventricle fractional shortening (LVFS), E/A ratio and isovolumic relaxation time (IVRT). (Mean± SEM, **P<0.01). G) Representative electron microscopy images of LDs and mitochondria in CD‐ and HFD‐fed mice heart. LDs are labeled as green while mitochondria are labeled as red. Scale bars, 1 µm. H) LDs diameter length quantifications from TEM images (Mean± SEM, n = 10 images per group, **P<0.01). I) Intra‐myocardial LD number were calculated to assess lipid accumulation in myocardium (Mean± SEM, n = 10 images per group, **P<0.01). J) Mean LD‐mitochondria (Mt) contact length was measured to reflect LD‐mitochondria tethering in myocardium (Mean± SEM, n = 10 images per group, *P<0.05, **P<0.01). K) Representative blot image and quantification of Mfn2 in hearts of CD‐ or HFD‐fed mice at different time points (Mean± SEM, n = 6 mice per group, **P<0.01). L&M) Pearson's correlation analysis was carried out to evaluate the correlation between Mfn2 expression and indicators for mitochondria‐LDs contact. CD, chow diet; HFD, high‐fat diet; LD, lipid droplet.
