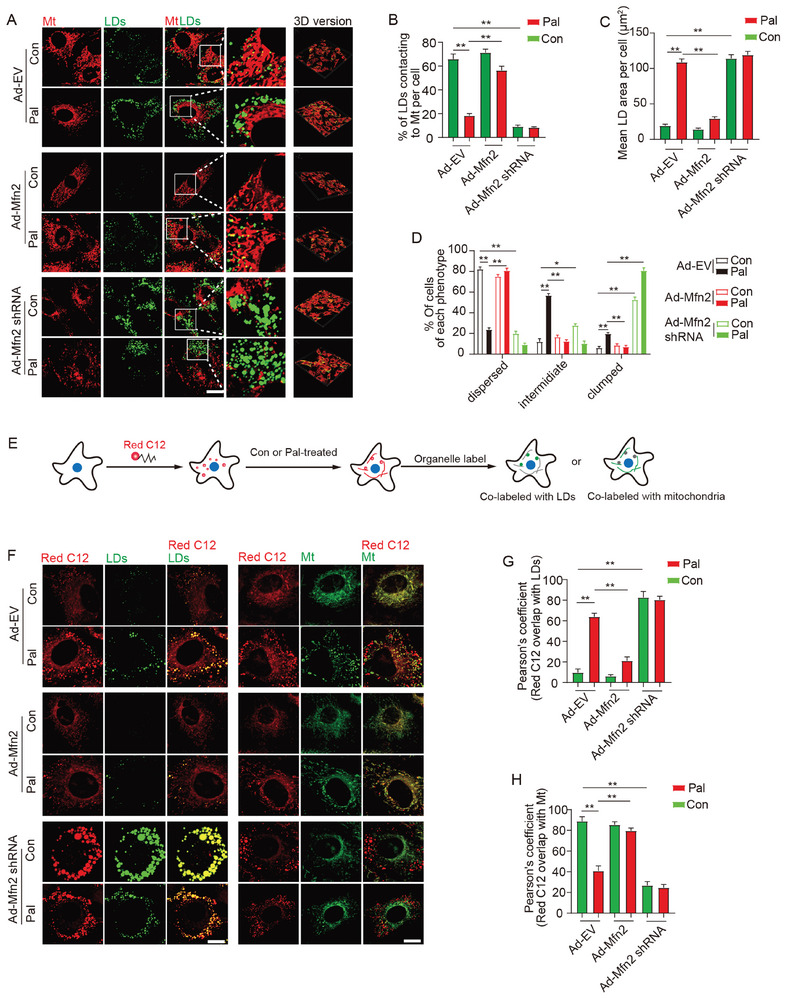
Figure 2.

Mfn2 facilitated MLC and FAs transfer from LDs to mitochondria. A) Control‐ or Pal‐ treated primary cardiomyocytes were transfected with adenovirus expressing Mfn2 (Ad‐Mfn2) or Mfn2 shRNA (Ad‐Mfn2 shRNA), then LDs were labeled with Bodipy 493/503 (green) and mitochondria was labeled with Mito‐tracker Red (red). Original magnification ×600. B) Percentage of LDs with direct contact to mitochondria was measured (Mean± SEM, n = 5 independent experiments, 30 cells were quantified per group, **P<0.01). C) Mean LD area per cell (Mean± SEM, n = 5 independent experiments, 30 cells were quantified per group, **P<0.01). D) Percentage of cells treated as in A and presenting different degrees of LD dispersion (Mean± SEM, n = 5 independent experiments, 15 images were quantified per group, **P<0.01). E) Schematic illustration of FAs tracking assay. F) FAs were chased with Bodipy 558/568 Red C12 and imaged to determine the subcellular localization of the FAs (red). LDs and mitochondria were also labeled (green). Original magnification ×600. G and H) Relative localization of Red C12‐labeled FAs with LDs or mitochondria was quantified by Pearson's coefficient analysis (Mean± SEM, n = 5 independent experiments, 30 cells were quantified per group, **P<0.01).
