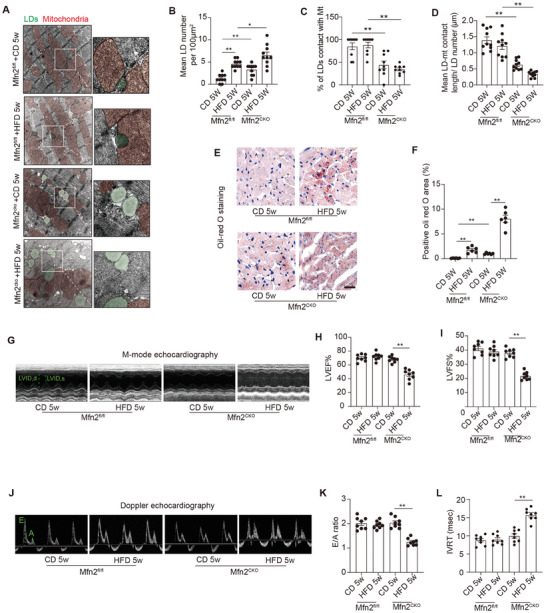
Figure 5.

Cardiac‐specific Mfn2 knock‐out mice displayed reduced MLC and increased intra‐myocardial lipid accumulation. A) Representative electron microscopy images of mitochondria and LDs from hearts of Mfn2fl/fl and Mfn2CKO mice after 5 weeks’ CD or HFD feeding. LDs are labeled as green while mitochondria are labeled as red. Scale bars, 1 µm. B) Intra‐myocardial LD number were calculated to assess lipid accumulation in myocardium (Mean± SEM, n = 10 images from 8 mice each group, **P<0.01). C) Percentage of LDs contact with mitochondria (Mean± SEM, n = 10 images from 8 mice each group, **P<0.01). D) Mean LD‐mitochondria contact length were measured to reflect LD‐mitochondria tethering in myocardium. (Mean± SEM, n = 10 images from 8 mice each group, **P<0.01). E) Oil‐red O staining showing intra‐myocardial lipid content, oil‐red O positive area are shown as red, scale bar = 25 µm. F) Quantitative analysis of positive Oil‐red O area in each group (Mean± SEM, n = 6 mice each group, **P<0.01). G–I) Echocardiographic assessment were performed on Mfn2fl/fl and Mfn2CKO mice after 5 weeks’ CD or HFD feeding. n = 8 mice per group. G) Representative images of M‐mode echocardiography. H and I) left ventricle ejection fraction (LVEF) and left ventricle fractional shortening (LVFS). J) Representative Doppler flow measurement of mitral inflow. K) E/A ratio. L) isovolumic relaxation time (IVRT). (Mean± SEM, **P<0.01). CD, chow diet; HFD, high‐fat diet; LD, lipid droplet.
