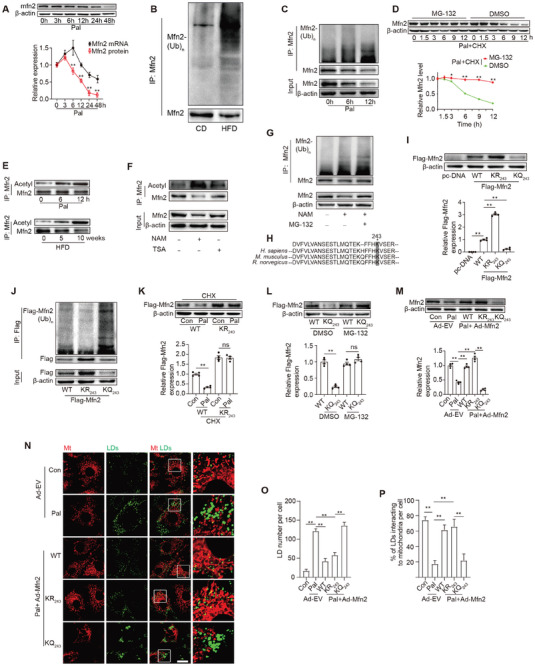
Figure 7.

Lipid overload promoted Mfn2 acetylation at K243 site and further degradation via a ubiquitin‐proteasome pathway. A) Quantification of Mfn2 protein and mRNA level in cardiomyocytes at different time points of Pal treating (Mean± SEM, n = 4 independent experiments, **P<0.01). B,C) Mfn2 ubiquitylation were detected in heart of HFD‐fed mice and palmitate‐treated primary cardiomyocytes (Mean± SEM, n = 4 independent experiments, **P<0.01). D) Palmitate‐treated cardiomyocytes were incubated with CHX (10 µM) and MG‐132 (10 µM) for the indicated periods of time. Mfn2 level were analyzed by western‐blotting. E) Acetylation level of Mfn2 were determined in vivo and in vitro at different time points of HFD‐feeding or palmitate treating (n = 4 mice in each group in vivo and 4 independent experiments in vitro). F) Trichostatin A (inhibitor of inhibitor of histone deacetylase, TSA, 50 nM) or nicotinamide (inhibitor of Sirtuins family, NAM, 20 mM) were used to induce Mfn2 acetylation in cardiomyocytes, and Mfn2 acetylation level were determined (n = 4 independent experiments). G) Mfn2 protein and ubiquitylation level were determined in cardiomyocytes in the presence of NAM or MG‐132. H) Alignment of the Mfn2 protein sequences surrounding lysine 243 from mouse to human, conserved lysine residues are shaded. I) Mfn2 K243 mutation leads to different protein level of Flag‐Mfn2 (Mean± SEM, n = 4 independent experiments, **P<0.01). J) Mfn2 protein and Mfn2 ubiquitylation level were determined (Mean± SEM, n = 4 independent experiments, **P<0.01). K) Western blotting images and summarized data showing the degradation of Flag‐Mfn2 (wild type [WT]) or Flag‐Mfn2 KR243 mutation (KR243) with or without palmitate and Chlorhexidine (CHX, 10 µM) incubation. L) Western blotting images and summarized data showing the degradation of Flag‐Mfn2 (wild type [WT]) or Flag‐Mfn2 KQ243 mutation (KQ243) with or without MG‐132 (10 µM) incubation (Mean± SEM, n = 4 independent experiments, **P<0.01). M) Mfn2 expression were determined by Western‐blot in cardiomyocytes as indicated. N) LDs were labeled with Bodipy 493/503 and mitochondria was labeled with Mito‐tracker Red. Original magnification ×600. O) LDs number per cell (Mean± SEM, n = 5 independent experiments, 30 cells were quantified per group, **P<0.01). P) Percent of LDs interacting to mitochondria per cell (Mean± SEM, n = 5 independent experiments, 30 cells were quantified per group, **P<0.01).
