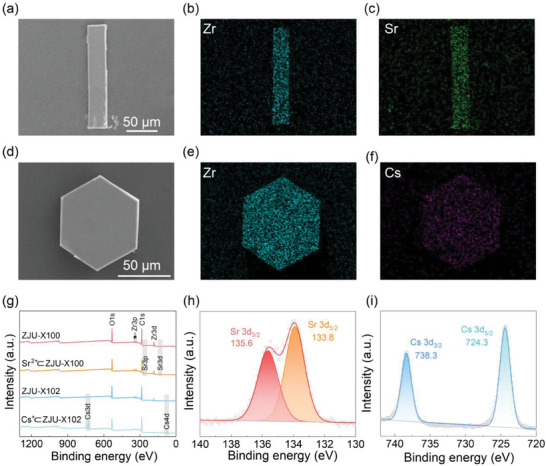
Figure 5.

SEM imagines of a) Sr2+⊂ZJU‐X100 and d) Cs+⊂ZJU‐X102. b,c) Corresponding EDS maps of Zr (dark cyan) and Sr (green) for Sr2+⊂ZJU‐X100. e,f) Corresponding EDS maps of Zr (dark cyan) and Cs (purple) for Cs+⊂ZJU‐X102. g) XPS spectra of ZJU‐X100, Sr2+⊂ZJU‐X100, ZJU‐X102, and Cs+⊂ZJU‐X102. h) High‐resolution Sr 3d spectrum of Sr2+⊂ZJU‐X100. f) High‐resolution Cs 3d spectrum of Cs+⊂ZJU‐X102.
