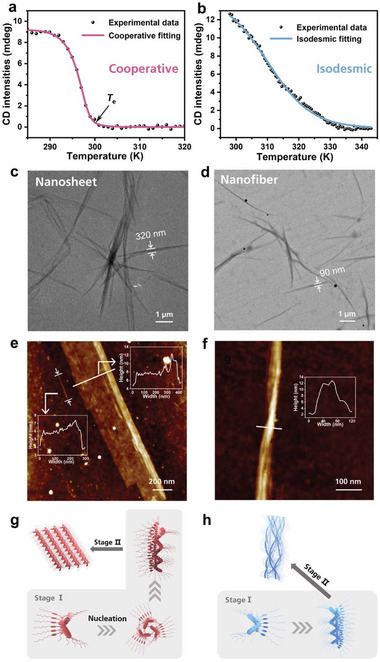
Figure 2.

a) CD variations at single point versus temperature during heating process (heating rate: 1 K min−1) of 1S assembly in DCE/MCH and the corresponding cooperative fitting. c = 16 µm. b) CD variations at single point versus temperature during heating process (heating rate: 1 K min−1) of 1S assembly in DCE/HE and the corresponding isodesmic fitting. c = 16 µm. c) TEM and e) AFM images of aggregate in DCE/MCH. d) TEM and f) AFM images of aggregate in DCE/HE. g) Schematic illustration of formation of hierarchical nanostructures of aggregate in DCE/MCH. h) Schematic illustration of formation of hierarchical nanostructures of aggregate in DCE/HE.
