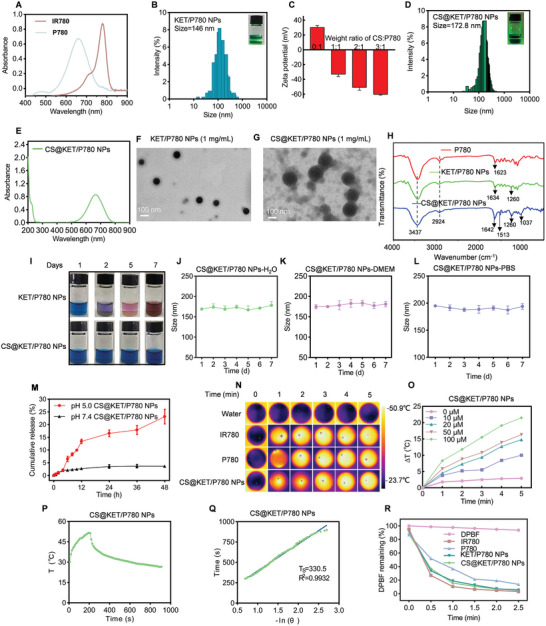
Figure 1.

Synthesis and characterization of CS@KET/P780 NPs. A) UV−vis spectra of IR780 and P780 in carbinol. B) Tyndall effect and size distribution of KET/P780 NPs. C) Zeta potentials of CS@KET/P780 NPs at different weight ratios of CS and P780. D) Tyndall effect and size distribution of CS@KET/P780 NPs. E) UV−vis spectra of CS@KET/P780 NPs in water. F,G) TEM image of KET/P780 NPs and CS@KET/P780 NPs. H) FTIR spectra of P780, KET/P780 NPs and CS@KET/P780 NPs. I) Photographs of KET/P780 NPs and CS@KET/P780 NPs at indicated time points. J) Size change of CS@KET/P780 NPs in H2O solution over a week (n = 3). K,L) Size change of CS@KET/P780 NPs in K) DMEM and L) PBS solution over a week (n = 3). M) Release profiles of P780 at pH 5.0 and 7.4. N) Infrared thermal images of water, IR780, P780 and CS@KET/P780 NPs after NIR laser irradiation (equivalent IR780/P780 concentration of 100 × 10−6 m, 660 nm for CS@KET/P780 NPs and P780, 808 nm for IR780, 1.0 W cm−2, 5 min). O) Temperature variations caused by 660 nm laser irradiation (1.0 W cm−2, 5 min) at various concentrations of CS@KET/P780 NPs. P) Temperature profile of CS@KET/P780 NPs in water after 200 s irradiation with a laser (λ = 660 nm) at a power of 1.0 W cm−2. Q) Linear time data versus ‐ln(θ) obtained from the cooling period of CS@KET/P780 NPs. R) Residual levels of DPBF in IR780, P780, KET/P780 NPs, CS@KET/P780 NPs (equivalent IR780/P780 concentration of 2.5 × 10⁻⁶ m) after NIR laser irradiation (808 nm for IR780, 660 nm for P780, KET/P780 NPs, and CS@KET/P780 NPs). The error bars represent the means ± SD (n = 3).
