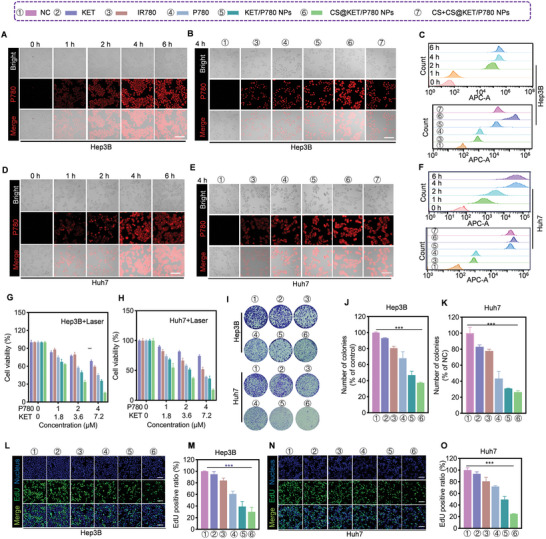
Figure 2.

The cellular uptake and cytotoxicity of CS@KET/P780 NPs in vitro. (The following experimental conditions are: 808 nm for IR780, 660 nm for P780, KET/P780 NPs and CS@KET/P780 NPs; P = 1.0 W cm−2, irradiation time = 30 s; C KET = 4.5 × 10⁻⁶ m, CP780 = 2.5 × 10⁻⁶ m). A,D) Fluorescence microscopy images of the cellular absorption of CS@KET/P780 NPs at various periods in Hep3B cells and Huh7 cells. Scale bar: 100 µm. B,E) Fluorescence microscopy images of the cellular uptake of IR780, P780, KET/P780 NPs, CS@KET/P780 NPs, and CS+ CS@KET/P780 NPs (cells were treated with CS for half an hour beforehand) in Hep3B and Huh7 cells following 4 h incubation. Scale bar: 100 µm. C,F) Results of cellular absorption in Hep3B and Huh7 cells using flow cytometry. G,H) Viability of Hep3B and Huh7 cells treated with KET, IR780, P780, KET/P780 NPs, and CS@KET/P780 NPs after NIR laser irradiation. I–K) Representative images of Hep3B and Huh7 cells after various treatments for colony formation and quantitative analysis. L,N) Fluorescence imaging and M,O) quantification analysis of EdU labeling assay in Hep3B and Huh7 cells under various treatments. Scale bar: 50 µm. (**P < 0.01; ***P < 0.001, one‐way ANOVA).
