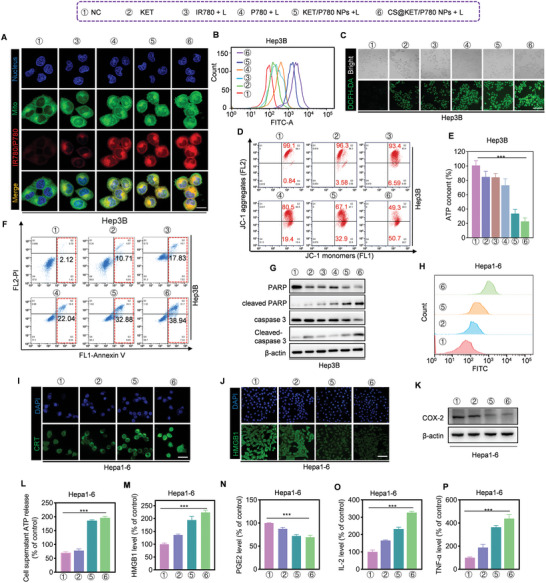
Figure 3.

CS@KET/P780 NPs evoke apoptosis through ROS accumulation and trigger ICD in liver cancer cells (The following experimental conditions are: 808 nm for IR780, 660 nm for P780, KET/P780 NPs, and CS@KET/P780 NPs; P = 1.0 W cm−2, irradiation time = 30 s; C KET = 4.5 × 10⁻⁶ m, C P780 = 2.5 × 10⁻⁶ m). A) LSCM images to display subcellular localization of IR780 or P780 with mitochondria. Scale bar:10 µm. B) Flow cytometry analysis and C) fluorescence imaging for intracellular ROS level of Hep3B cells using DCFH‐DA as a probe. Scale bar:100 µm. D) Flow cytometry analysis for mitochondrial membrane potential of Hep3B cells following different treatments. E) ATP content in Hep3B cells following different treatments. F) Flow cytometry findings of apoptosis in Hep3B cells after various treatments. G) Western blot analysis of apoptotic markers for Hep3B cells following different treatments. H,I) Flow cytometry evaluation and immunofluorescence staining of the CRT on the surface of Hepa1‐6 cells following various treatments. Scale bar:10 µm. J) Hepa1‐6 cells were labeled with HMGB1 immunofluorescence following various treatments. Scale bar: 60 µm. K) Western blot analysis of the COX‐2 in Hepa1‐6 cells following various treatments. L) ATP content in the supernatant of Hepa1‐6 cells after various treatments. M) HMGB1, N) PGE2, O) IL‐2, and P) TNF‐α in the supernatant of Hepa1‐6 cells after various treatments. (***P < 0.001, one‐way ANOVA).
