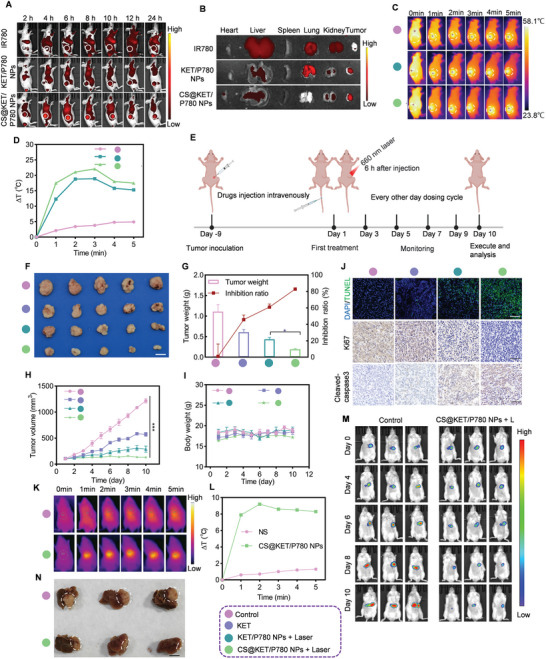
Figure 4.

In vivo biodistribution and anti‐liver cancer performance of CS@KET/P780 NPs in BALB/c nude mice. The mice were treated with normal saline, free KET, KET/P780 NPs with laser irradiation, or CS@KET/P780 NPs with laser irradiation (The following experimental conditions are: λ = 660 nm, P = 1.0 W cm−2; irradiation time = 3 min; C KET = 2 mg kg−1, C P780 = 2 mg kg−1, V = 100 µL). A) Real‐time in vivo imaging of IR780, KET/P780 NPs, and CS@KET/P780 NPs following intravenous injection in the Hep3B tumor‐bearing BALB/c nude mice model. B) Analysis of radiance intensity of dissected major organs and tumors at 24 h postadministration. C) Images captured when BALB/c nude mice were exposed to NIR laser radiation at various time intervals at tumor locations. The white circles represent tumor sites. (P = 1.0 W cm−2 for 0, 1, 2, 3, 4, and 5 min). D) Temperature‐change profiles at the tumor sites following intravenous administration. E) Schematic representation of the design and procedure of tumor treatment of the Hep3B tumor‐bearing BALB/c nude mice model. Created with BioRender.com. F) Representative pictures of isolated tumors. Scale bar: 0.5 cm. G) The tumor weight of different groups and the inhibition rate. H) The tumor volume of mice in each group and I) the corresponding body weight were measured at indicated time points (n = 5). Scale bar: 50 µm. J) TUNEL and immunohistochemical staining of cleaved‐caspase 3 and Ki67 in tumor tissues after various strategies. K) Images captured when NSG mice were exposed to NIR laser radiation at various time intervals at tumor locations. The red circles represent tumor sites. (P = 1.0 W cm−2 for 0, 1, 2, 3, 4, and 5 min). L) Temperature‐change profiles at the tumor sites following intravenous administration. M) In vivo bioluminescence images of the orthotopic Hep3B‐Luc tumors at different time intervals from Day 0 to Day 10. N) Digital photo of the isolated tumor tissues from the liver after various treatments on Day 10. The reddish‐brown tissue is the residual liver. The white tissue is the tumor. Scale bar: 0.5 cm. (***P < 0.001, one‐way ANOVA).
