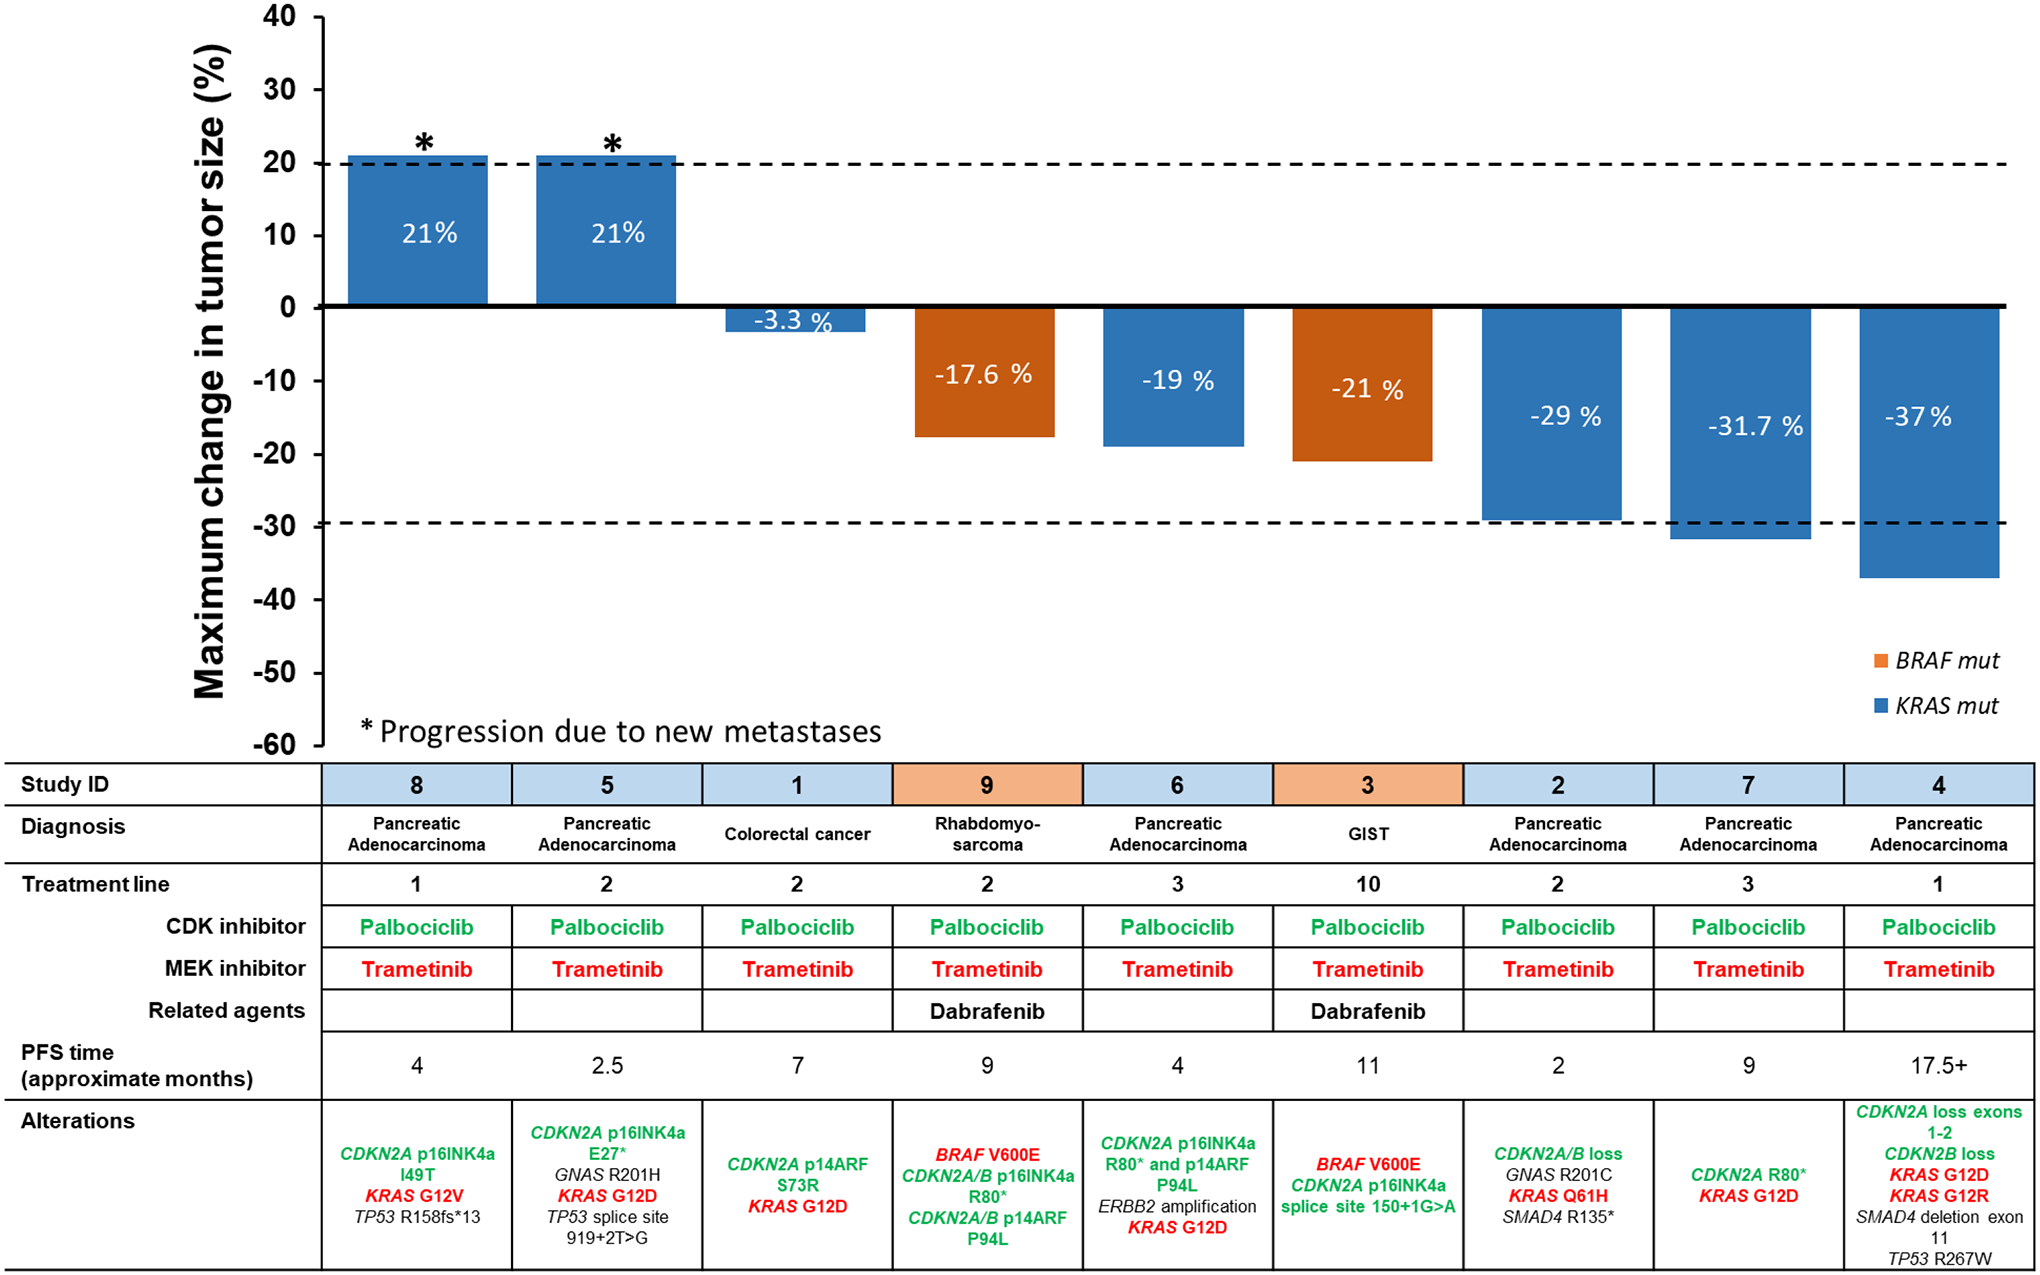
Figure 1.

Waterfall plot showing patient and tumor molecular characteristics, treatment and percent change in tumor size. (New metastases were graphed as 21% progression. Treatment line refers to therapies in the metastatic setting.
Patients ID 4,5 and 8 also received bevacizumab. ID 6 also received lapatinib and trastuzumab.
