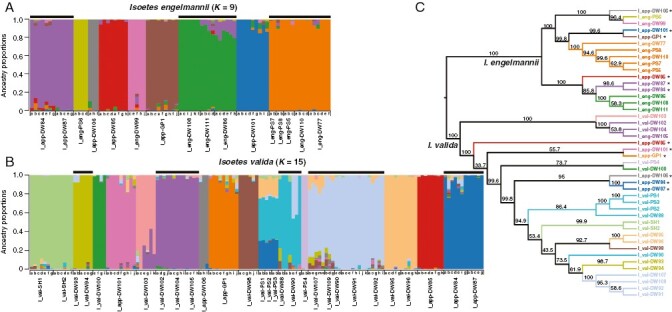
Fig. 4.

Admixture plots and phylogeny of RADseq data. (A, B) Bar plot of ancestry proportions in (A) I. engelmannii and (B) I. valida at optimal values of K. (C) Phylogeny built in SVDquartets from consensus loci of each locality with tips coloured to indicate the predominant ancestry in each locality. Phased polyploid taxa are marked with an asterisk in the phylogeny. Black bars over admixture plots indicate ancestral clusters spanning multiple watershed regions.
