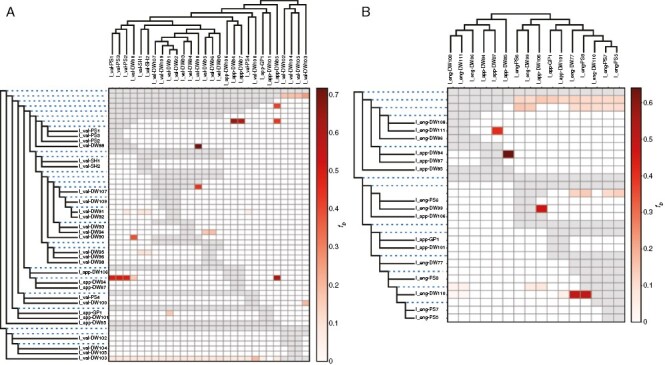
Fig. 5.

f-Branch statistics calculated from RADseq data aggregated by locality with associated phylogenies showing gene flow and phylogenetic relationships among sites of (A) I. valida and (B) I. engelmannii with associated phased I. appalachiana localities. Displayed f-branch statistics have a P-value of <0.005. Grey cells correspond to combinations for which the f-branch cannot be calculated given the topology of the tree.
