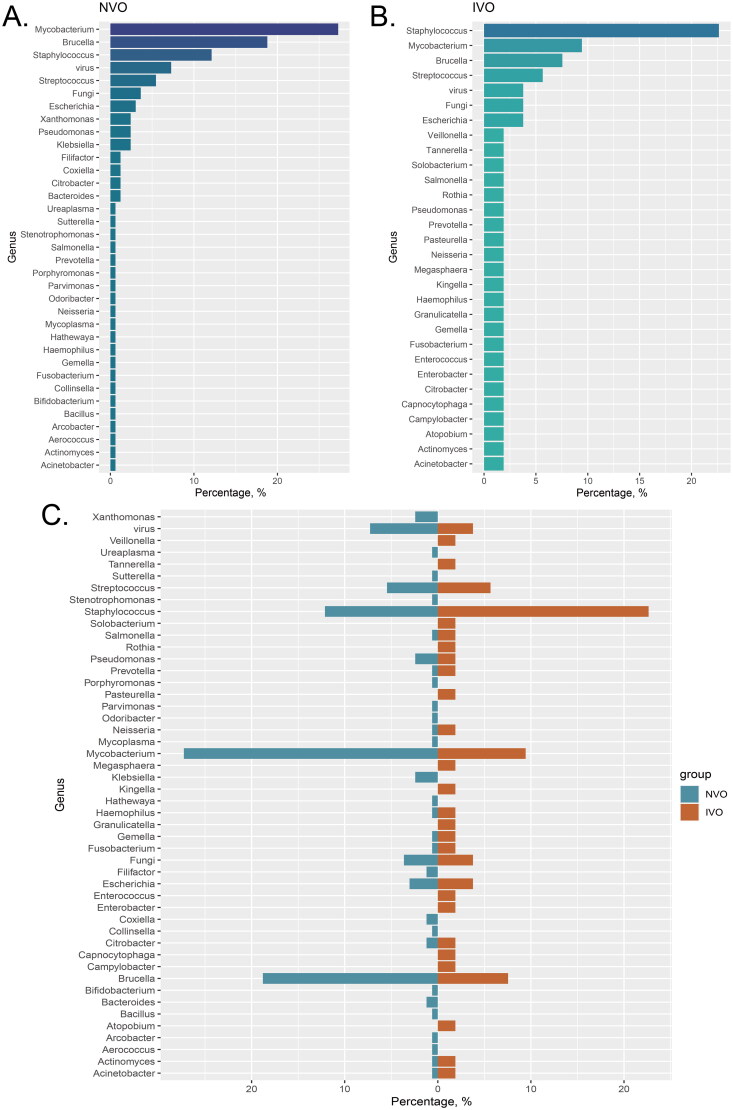
Figure 2.
Classifying the pathogens of IVO and NVO at the genus level A, The bar chart illustrates the distribution of different pathogen species in the Native Vertebral Osteomyelitis (NVO) group. B, The bar chart illustrates the distribution of different pathogen species in the Iatrogenic Vertebral Osteomyelitis (IVO) group. C, The bidirectional bar graph demonstrates the distribution differences of pathogen species between the NVO and IVO groups.

