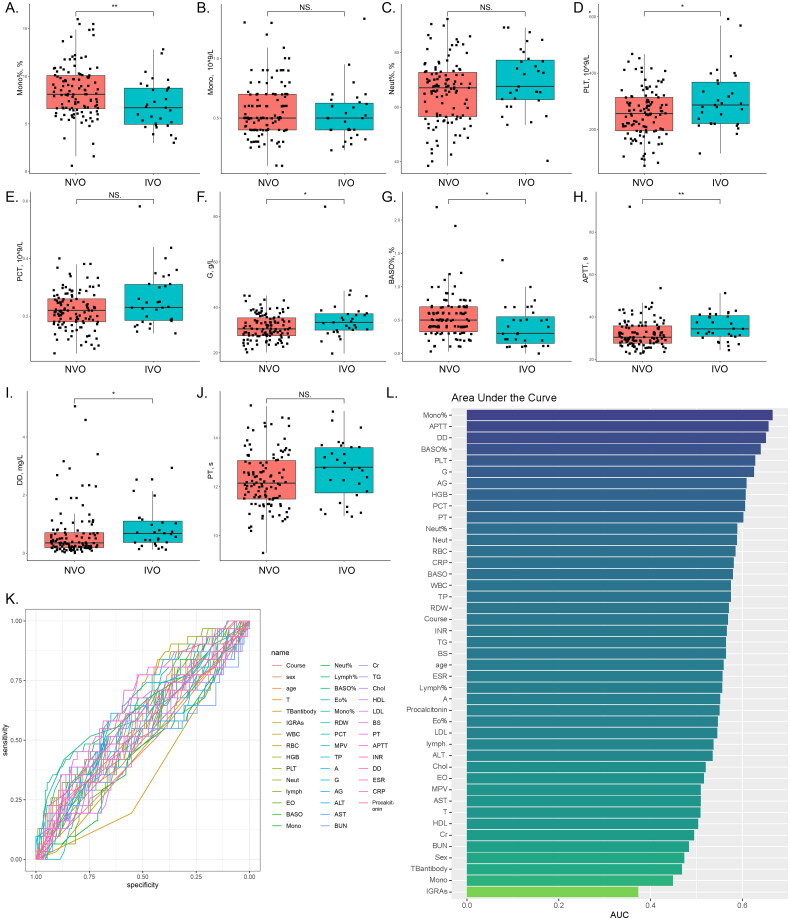
Figure 3.
Comparison of routine serological indicators of IVO and NVOA-J, The observed significant differences or trends in parameters between the IVO and NVO groups are illustrated by box plots and scatter plots (*P<0.05, **P<0.01, ***P<0.001). K, Receiver operating characteristic (ROC) analysis for each variable based on the IVO and NVO groups. L, The bar chart represents the ranking of area under the curve (AUC) values for all ROC curves.

