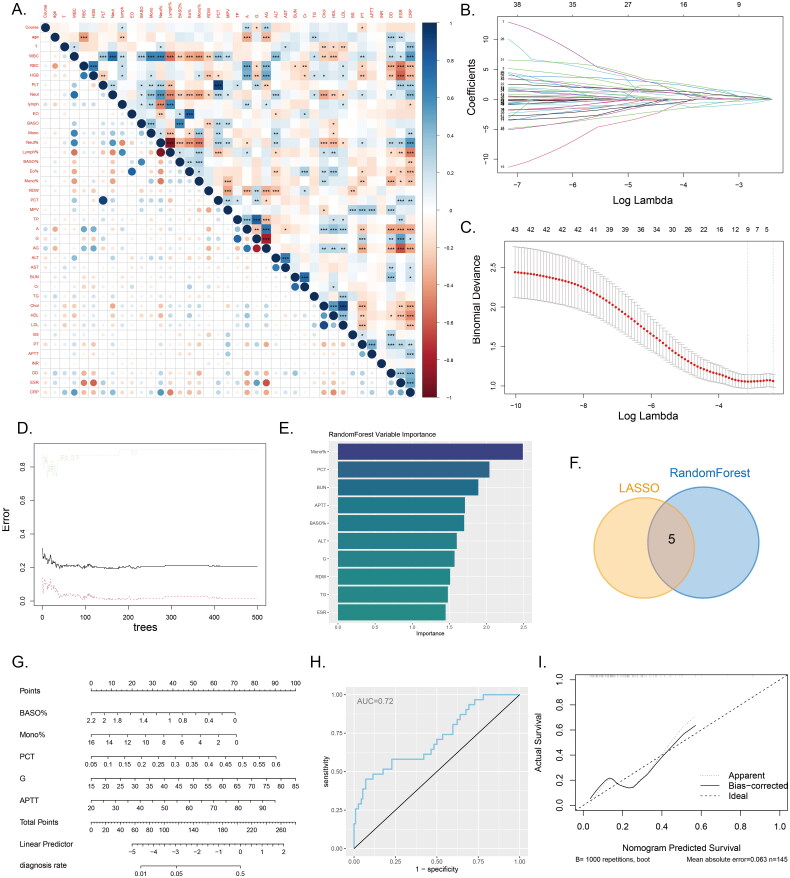
Figure 4.
Machine learning and nomogram A, The correlation heatmap displays the correlations between various continuous variables. (*P<0.05, **P<0.01, ***P<0.001). B-C, Variable selection using LASSO regression. D-E, Variable selection using a random forest model to identify the top ten important variables. F, The Venn diagram illustrates the intersection between the results of LASSO regression and the random forest model. G, Nomogram model used to differentiate IVO and NVO. H, ROC curve of the nomogram model. I, Calibration curve of the nomogram model.

