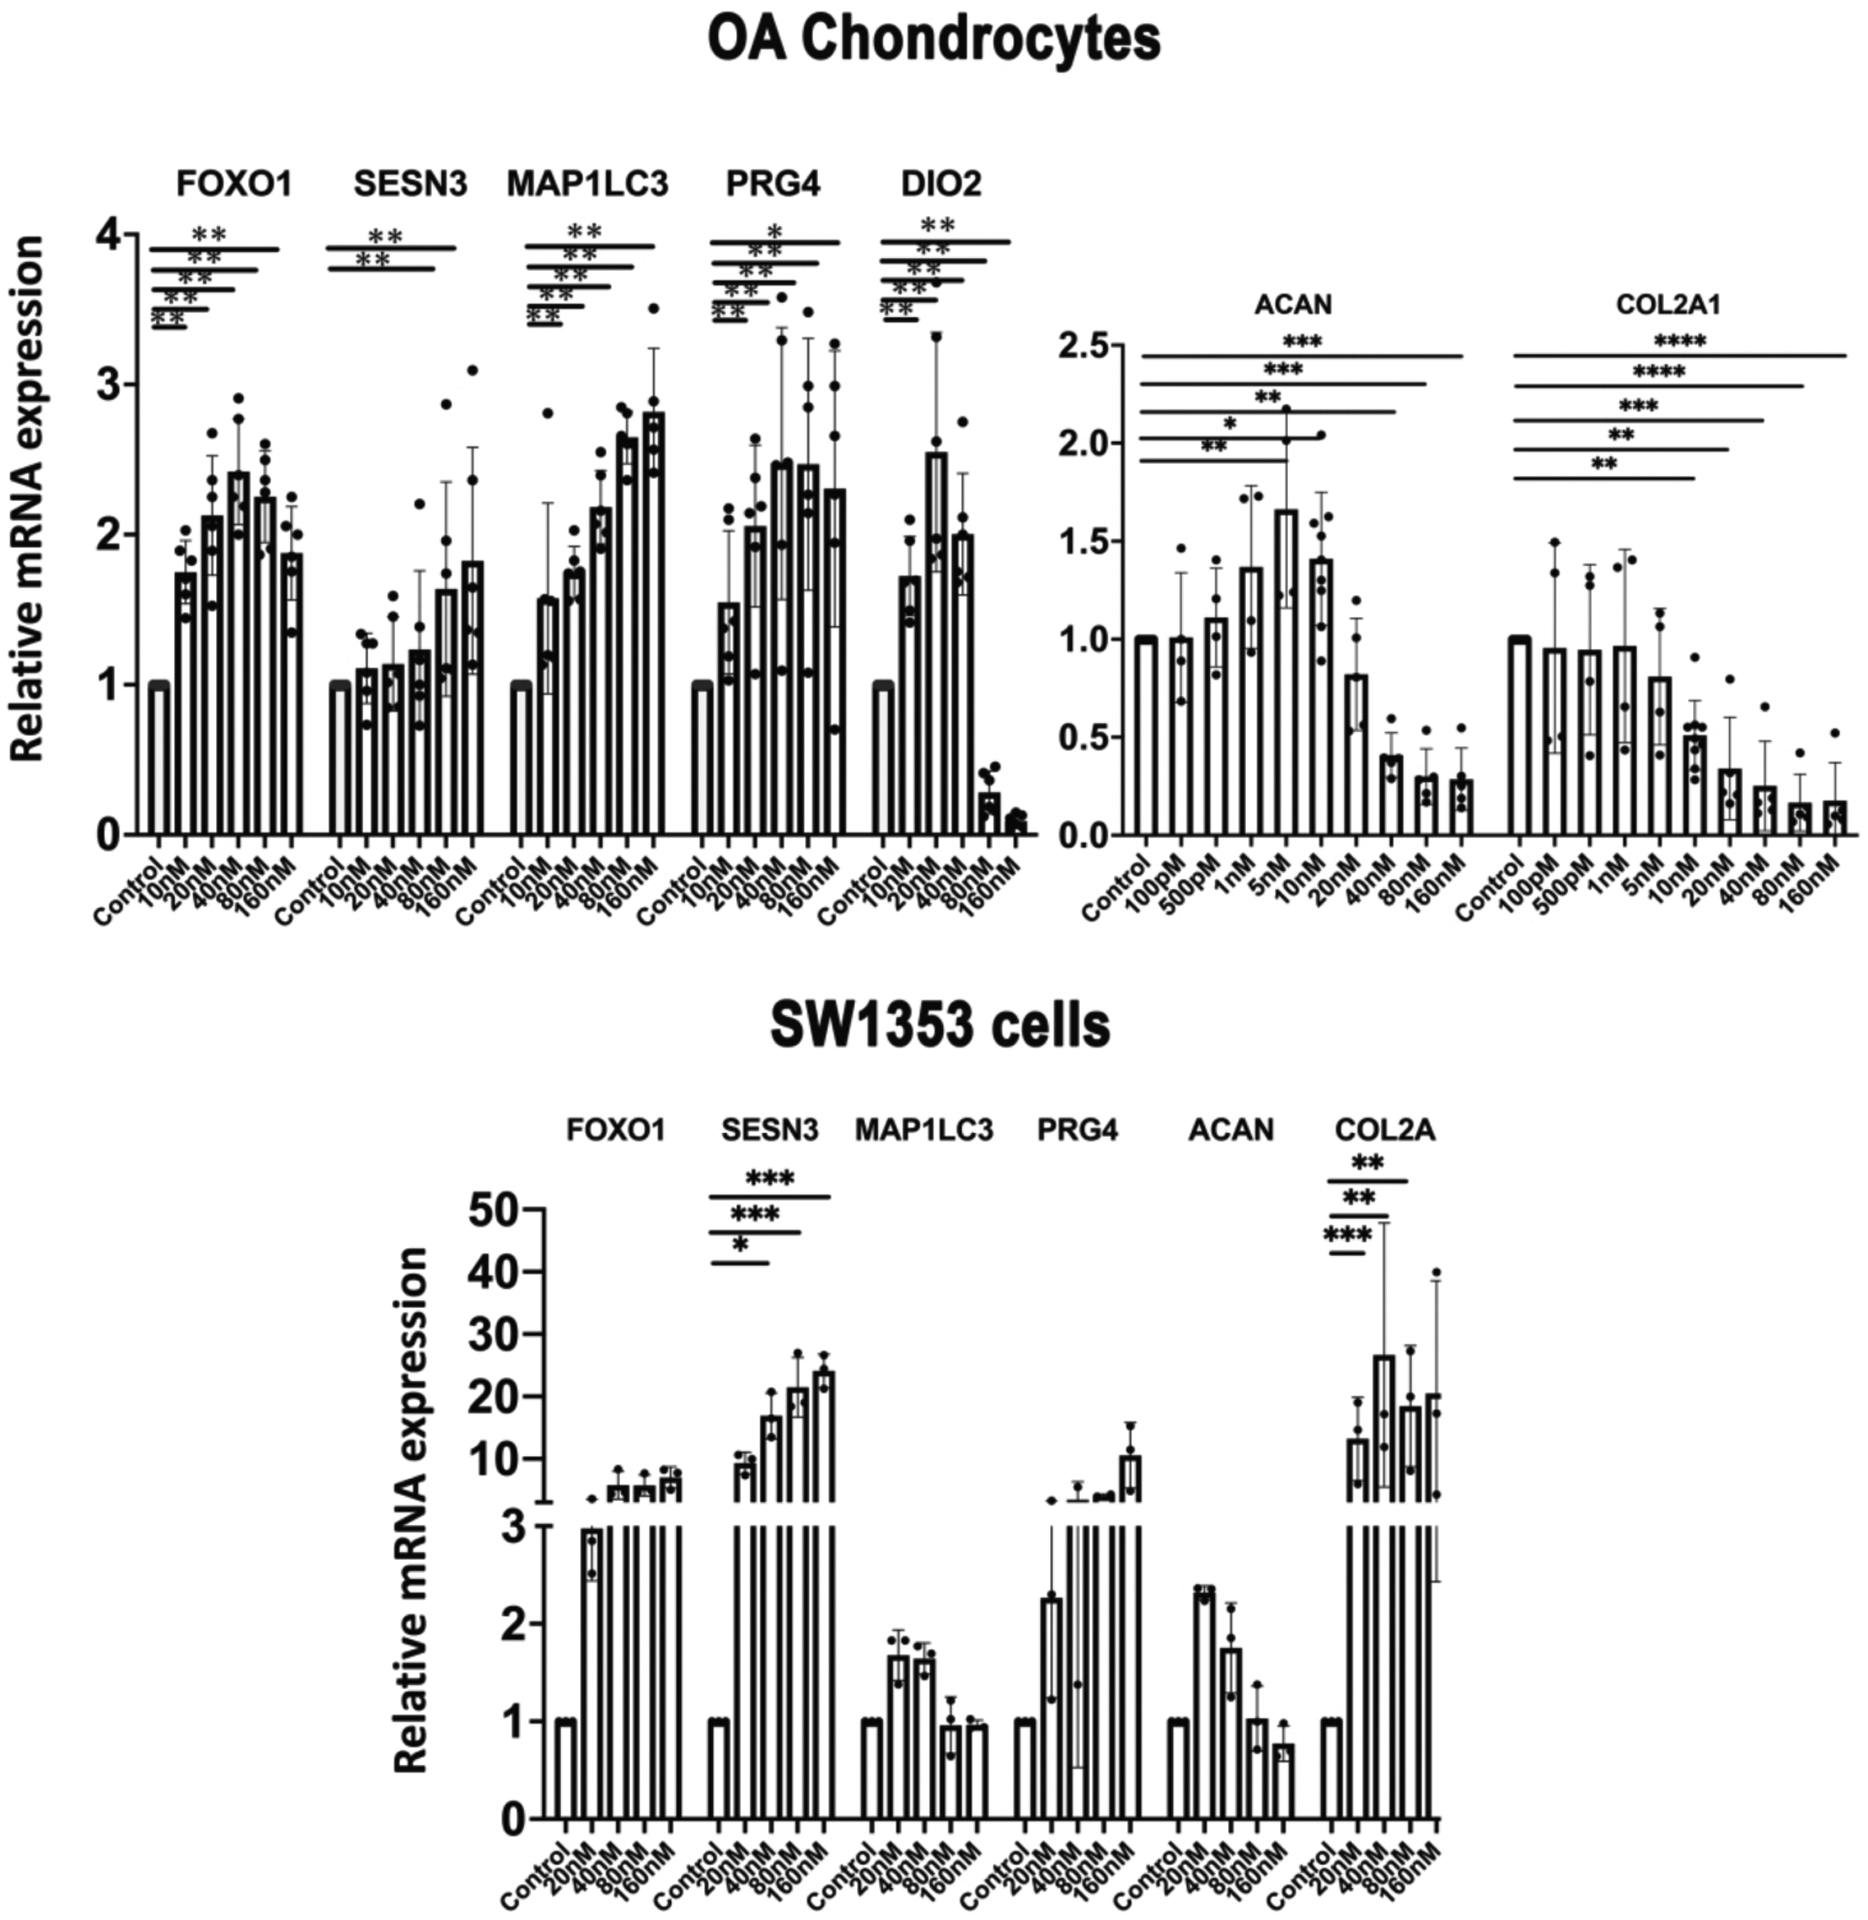
Figure 2. Panobinostat and homeostasis and cartilage ECM genes.

(A). Chondrocytes
Human OA chondrocytes (passage 1) from 5 donors were incubated with the indicated doses of Panobinostat for 24 h and RNA was isolated for qRT-PCR analysis.
(B). SW1353 human chondrosarcoma cells
SW1353 cells were treated with the indicated doses of Panobinostat for 24 h and RNA was isolated for qRT-PCR analysis. Independent experiments (N=3) were performed where each condition was tested in duplicate for each condition.
****= p<0.0001; ***= p<0.001; **= p<0.01; *= p<0.05
