. 2024 Mar 21;67(4):1042–1071. doi: 10.1044/2024_JSLHR-23-00415

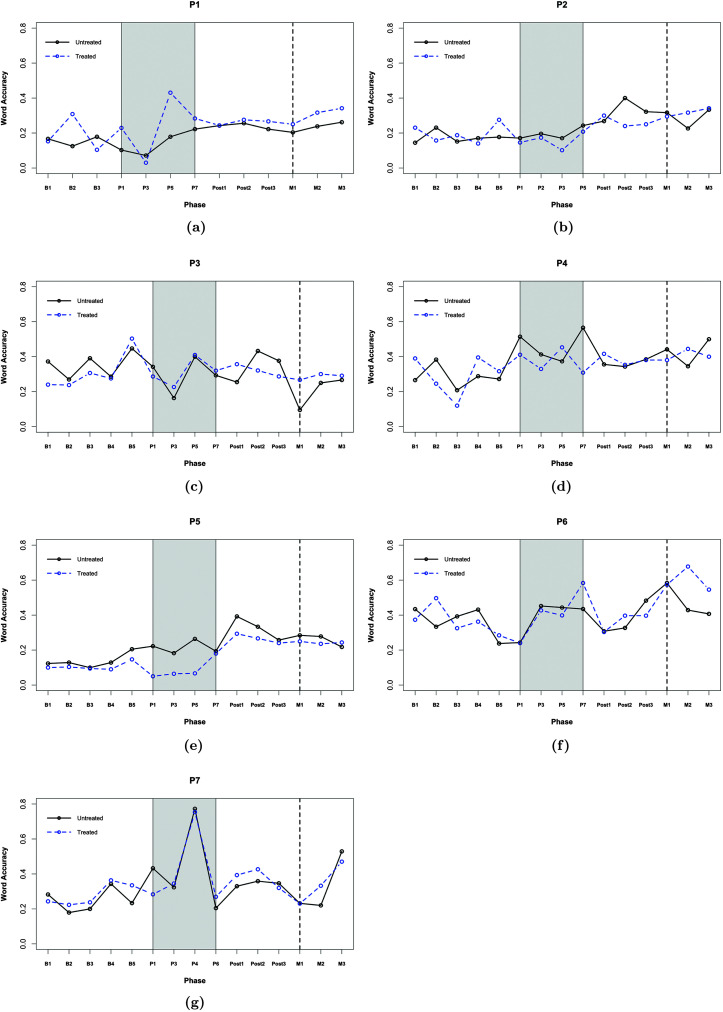
Figure 3.

7 graphs plot the word accuracy on the y axis and the phase on the x axis for the untreated and treated conditions. The legend is as follows. Solid black line: Untreated. Dashed blue line: Treated. a. Graph 1: P1. The solid line passes through the following points. B 1: 0.18. B 2: 0.15. B 3: 0.18. P 1: 0.1. P 3: 0.06. P 5: 0.2. P 7: 0.21. The data for the solid black line is as follows. B 1: 0.18. B 2: 0.16. B 3: 0.2. P 1: 0.1. P 3: 0.09. P 5: 0.2. P 7: 0.22. Post 1: 0.24. Post 2: 0.25. Post 3: 0.21. M 1: 0.2. M 2: 0.21. M 3: 0.22. The data for the dashed blue line is as follows. B 1: 0.17. B 2: 0.32. B 3: 0.1. P 1: 0.22. P 3: 0.02. P 5: 0.42. P 7: 0.28. Post 1: 0.21. Post 2: 0.25. Post 3: 0.25. M 1: 0.21. M 2: 0.28. M 3: 0.3. A dashed vertical line is marked at M 1. The region between P 1 and P 7 is shaded. b. Graph 2: P 2. The data for the solid black line is as follows. B 1: 0.15. B 2: 0.22. B 3: 0.17. B 4: 0.19. B 5: 0.19. P 1: 0.19. P 2: 0.2. P 3: 0.18. P 5: 0.23. Post 1: 0.27. Post 2: 0.4. Post 3: 0.32. M 1: 0.31. M 2: 0.22. M 3: 0.32. The data for the dashed blue line is as follows. B 1: 0.21. B 2: 0.18. B 3: 0.2. B 4: 0.17. B 5: 0.28. P 1: 0.16. P 2: 0.18. P 3: 0.1. P 5: 0.2. Post 1: 0.29. Post 2: 0.4. Post 3: 0.35. M 1: 0.33. M 2: 0.2. M 3: 0.3. A dashed vertical line is marked at M 1. The region between P 1 and P 5 is shaded. A dashed vertical line is marked at V 1. c. Graph 3: P 3. The data for the solid black line is as follows. B 1: 0.39. B 2: 0.29. B 3: 0.4. B 4: 0.3. B 5: 0.42. P 1: 0.36. P 3: 0.18. P 5: 0.4. P 7: 0.3. Post 1: 0.24. Post 2: 0.42. Post 3: 0.38. M 1: 0.09. M 2: 0.21. M 3: 0.22. A dashed vertical line is marked at M 1. The region between P 1 and P 7 is shaded. d. Graph 4: P 4. The data for the solid black line is as follows. B 1: 0.25. B 2: 0.39. B 3: 0.21. B 4: 0.29. B 5: 0.29. P 1: 0.5. P 3: 0.41. P 5: 0.38. P 7: 0.58. Post 1: 0.36. Post 2: 0.36. Post 3: 0.4. M 1: 0.42. M 2: 0.32. M 3: 0.49. A dashed vertical line is marked at M 1. The region between P 1 and P 7 is shaded. e. Graph 5: P 5. The data for the solid black line is as follows. B 1: 0.12. B 2: 0.12. B 3: 0.1. B 4: 0.13. B 5: 0.21. P 1: 0.22. P 3: 0.19. P 5: 0.23. P 7: 0.19. Post 1: 0.4. Post 2: 0.31. Post 3: 0.22. M 1: 0.23. M 2: 0.23. M 3: 0.19. The data for the dashed blue line is as follows. B 1: 0.1. B 2: 0.1. B 3: 0.1. B 4: 0.1, B 5: 0.15. P 1: 0.05. P 3: 0.06. P 5: 0.06. P 7: 0.19. Post 1: 0.24. Post 2: 0.22. Post 3: 0.21. M 1: 0.21. M 2: 0.21. M 3: 0.21. A dashed vertical line is marked at M 1. The region between P 1 and P 7 is shaded. f. Graph 6: P 6. The data for the solid black line is as follows. B 1: 0.42. B 2: 0.35. B 3: 0.4. B 4: 0.42. B 5: 0.22. P 1: 0.22. P 3: 0.43. P 5: 0.43. P 7: 0.42. Post 1: 0.35. Post 2: 0.37. Post 3: 0.5. M 1: 0.78. M 2: 0.41. M 3: 0.4. The data for the dashed blue line is as follows. B 1: 0.38. B 2: 0.5. B 3: 0.32. B 4: 0.36. B 5: 0.28. P 1: 0.23. P 3: 0.45. P 5: 0.45. P 7: 0.45. Post 1: 0.32. Post 2: 0.35. Post 3: 0.48. M 1: 0.57. M 2: 0.64. M 3: 0.57. A dashed vertical line is marked at M 1. The region between P 1 and P 7 is shaded. g. Graph 7: P 7. The data for the solid black line is as follows. B 1: 0.3. B 2: 0.19. B 3: 0.2. B 4: 0.3. B 5: 0.22. P 1: 0.42. P 3: 0.32. P 4: 0.78. P 6: 0.19. Post 1: 0.3. Post 2: 0.31. Post 3: 0.3. M 1: 0.21. M 2: 0.2. M 3: 0.49. The data for the dashed blue line is as follows. B 1: 0.22. B 2: 0.22. B 3: 0.23. B 4: 0.35. P 1: 0.28. P 3: 0.25. P 4: 0.78. P 6: 0.25. Post 1: 0.38. Post 2: 0.41. Post 3: 0.28. M 1: 0.2. M 2: 0.3. M 3: 0.42. A dashed vertical line is marked at M 1. The region between P 1 and P 6 is shaded.

Average word accuracy (MACS score) across all treated words (solid black line) and untreated words (dashed blue line) is shown for each child (a = P1, b = P2, c = P3, d = P4, e = P5, f = P6, and g = P7). Word accuracy is displayed on the y-axis. Treatment phase is displayed on the x-axis and displays baseline, treatment (gray shading), posttreatment, and maintenance (dotted vertical line). MACS = Multilevel word Accuracy Composite Scale.