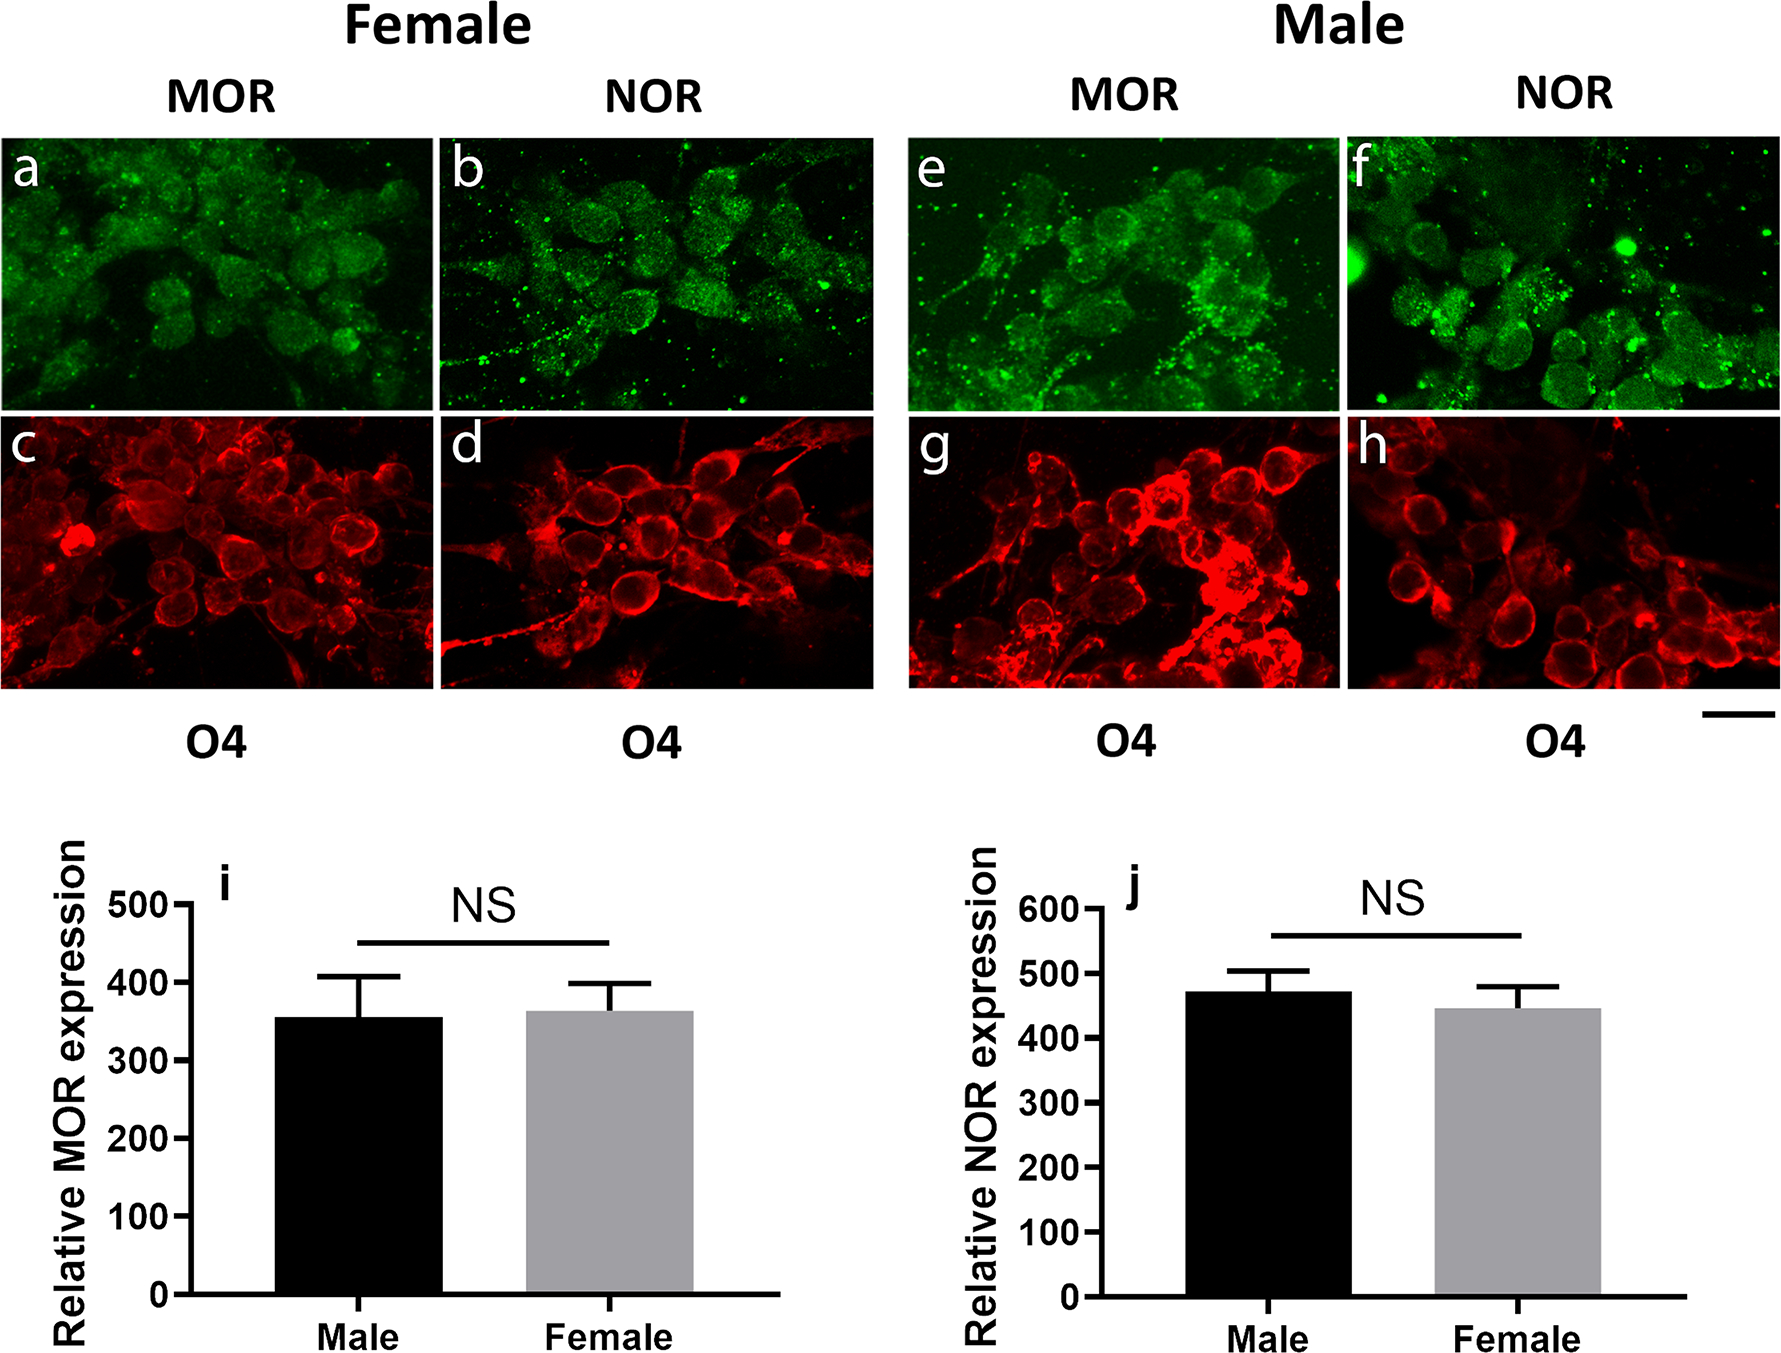
FIGURE 2. Male and female pre-oligodendrocytes express MOR and NOR.

MOR and NOR expression were analyzed in pre-oligodendrocytes isolated from 9-day-old male and female pups. Following overnight attachment to the culture plates, cells were subjected to double immunostaining with O4 (red) antibody (c, d, g, and h) together with either anti-MOR (a and e) or anti- NOR (b and f) antibodies (green). Scale bar: 20 μm. Relative levels of MOR (i) and NOR (j) expression were determined as indicated under Methods. The bar graphs represent the mean ± SEM from 5 fields (average of 10 cells each) per group. Males vs. females, NS.
