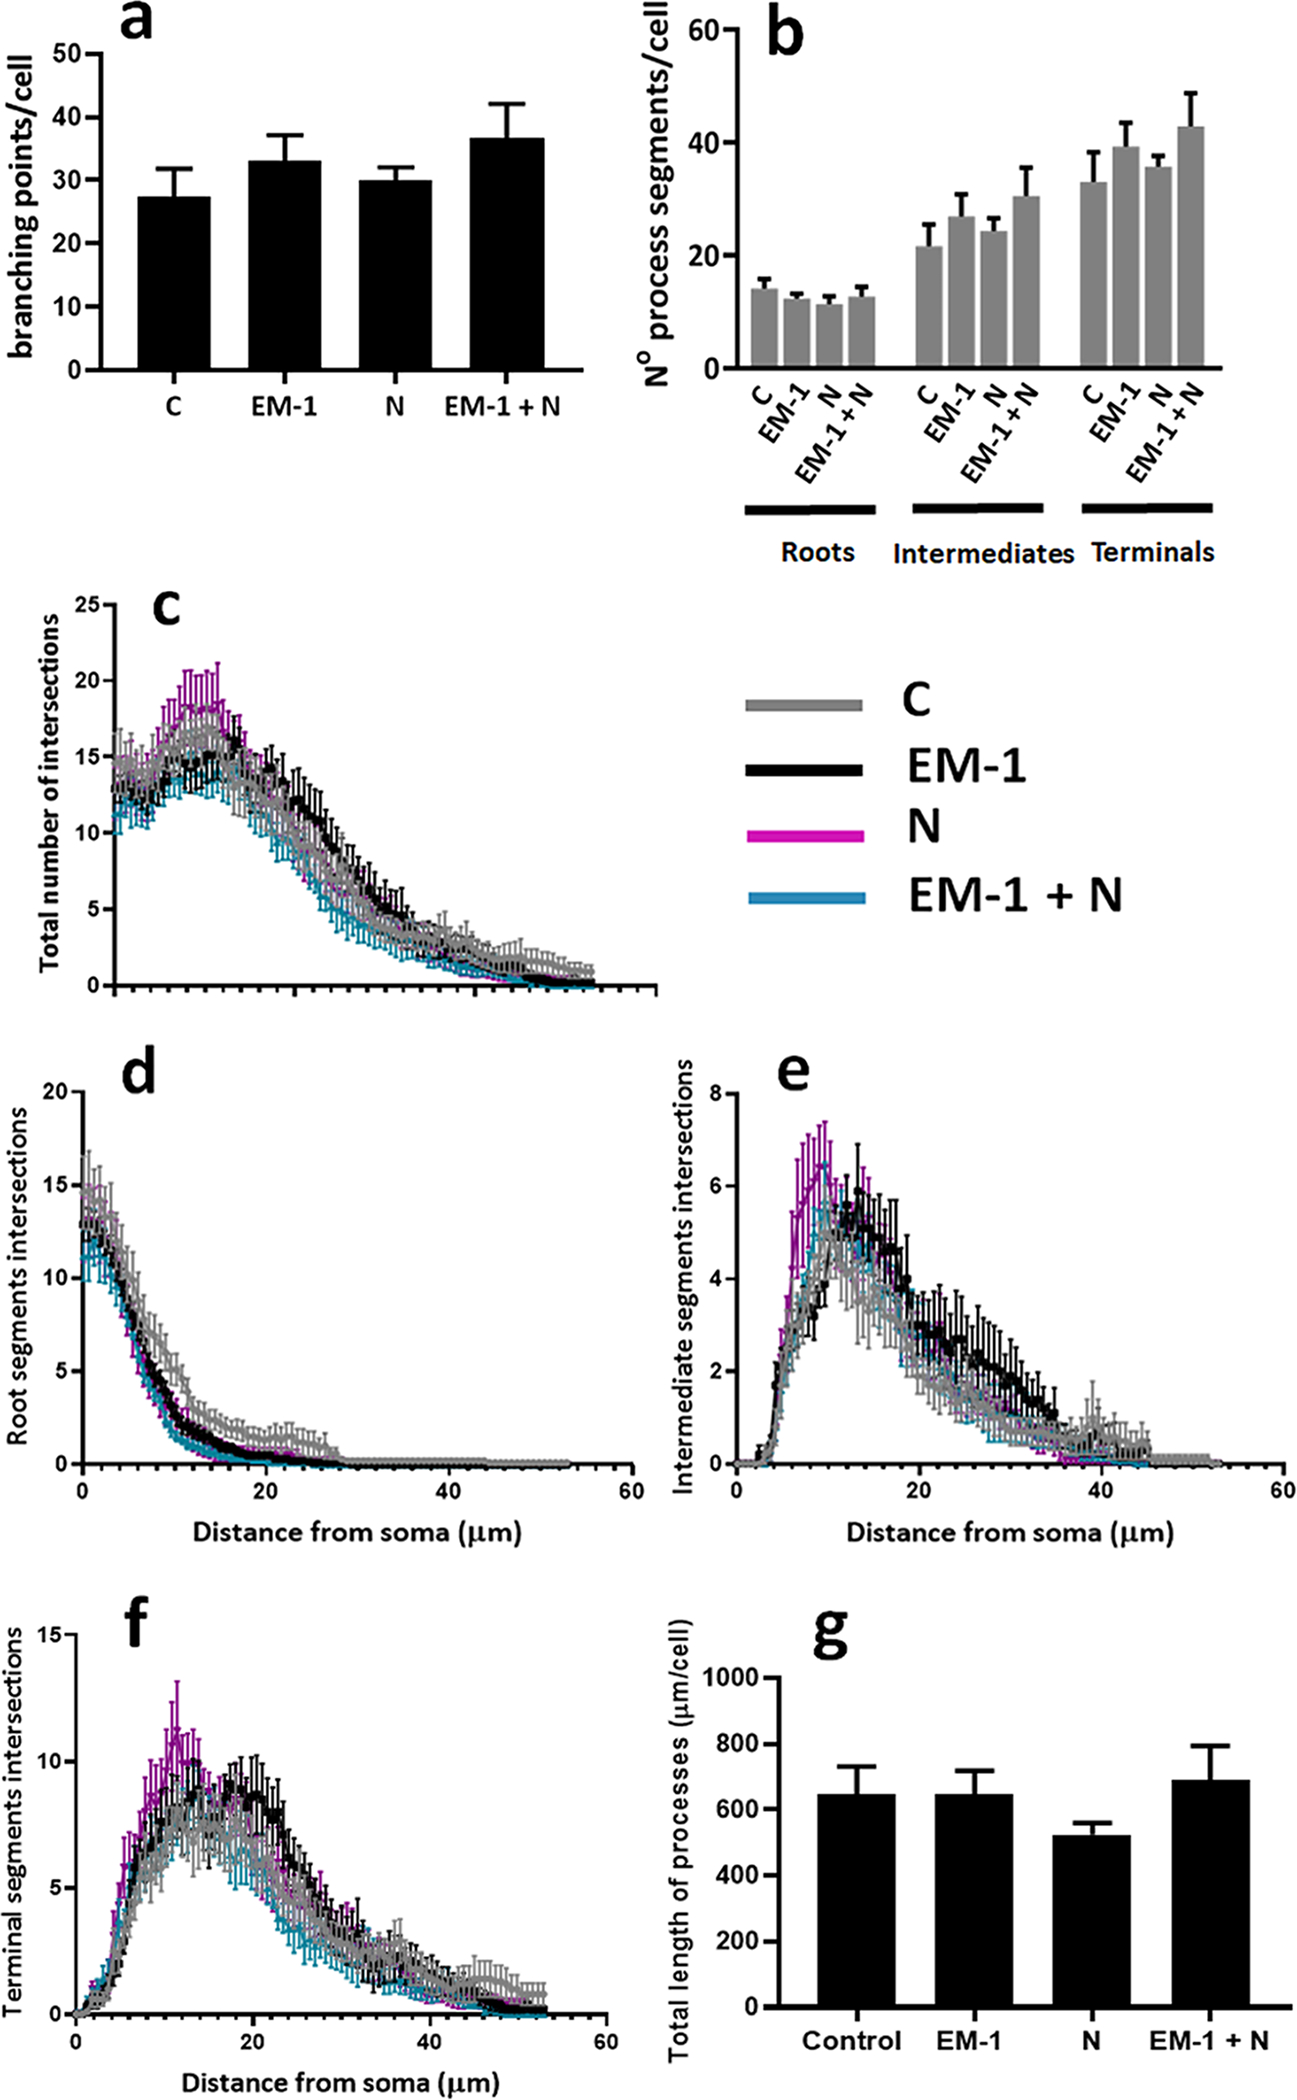
FIGURE 7. Quantification of EM-1 and nociceptin effects on cell process complexity and length in male oligodendrocytes.

Pre-oligodendrocytes isolated from male pups were exposed to the same experimental conditions and subjected to the same analysis applied to female cells as indicated in the legend to Figure 4. (a) Average number of branching points/cell. (b) Average number of process segments within each category/cell. Shown are the results of the semi-automated Sholl analysis indicating the number of intersections for the total number of segments (c), roots (d), intermediate segments (e), and terminal segments (f). Results are expressed as the mean ± SEM for ten randomly selected cells analyzed per culture condition. (g) The bar graph represents the total length of processes; calculated as the added length of roots, intermediates and terminals under each culture condition. Ten randomly selected cells were analyzed per culture condition.
