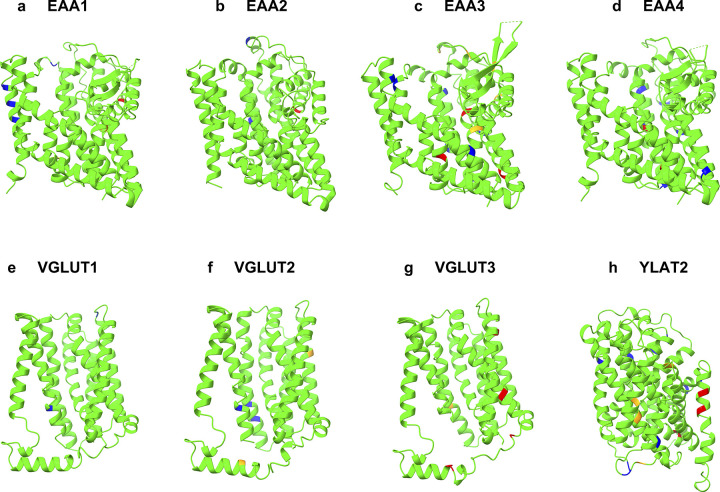
Fig 6. Natural mutations of QTY-code.
The native structures (green) and predicted effects of QTY and reverse-QTY mutations are shown as colored residues. Blue = benign, orange = possibly damaging with low confidence, red = damaging with high confidence. a EAA1, b EAA2, c EAA3, d EAA4, e VGLUT1, f VGLUT2, g VGLUT3, h YLAT2. For clarity, N- and C termini and large loops are deleted.

