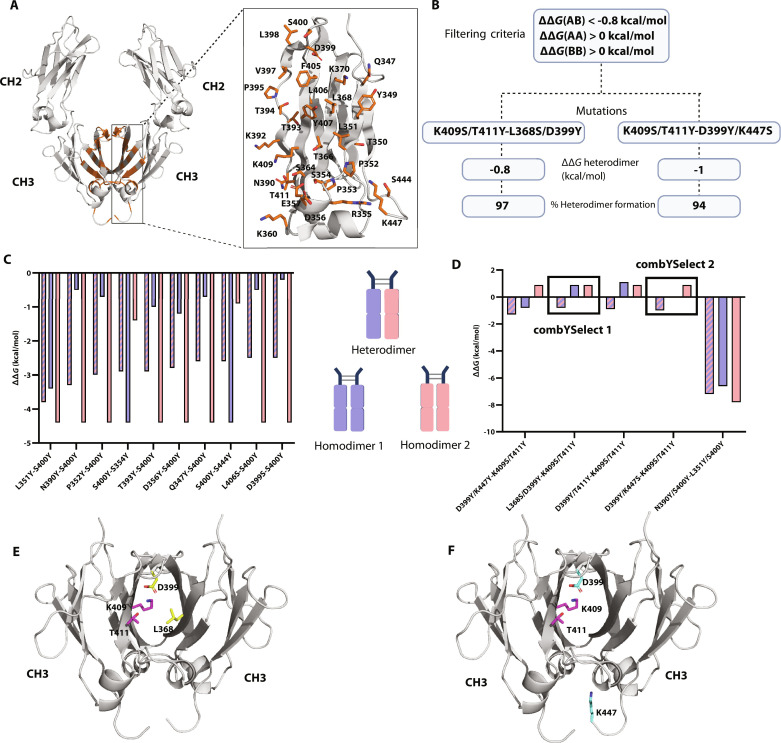
Fig. 1. combYSelect screening strategies and workflow.
(A) AlphaFold model of IgG1 Fc that was used for in silico mutation screen, with residues identified to be 4 Å apart from another residue on the opposing chain highlighted in orange stick form. (B) Schematic depicting the combYSelect strategy used to screen for mutations that promote IgG1 heterodimer formation. We used the interface mode of Rosetta coupled with restricting mutations to tyrosine (Y) and serine (S) and filtering based on ΔΔGhomodimer and ΔΔGheterodimer values. (C) Bar graph depicting the computationally determined ΔΔG values for heterodimers (blue-pink stripes) or homodimers (blue, when the mutation listed first is considered, and pink when the mutation listed second is considered) of Fcs, in which only one residue on each chain was mutated. (D) Bar graph depicting the computationally determined ΔΔG values for heterodimers (blue-pink stripes) or homodimers (blue, when the set of mutations listed first is considered, and pink when the set of mutations listed second is considered) of Fcs, in which two residues on each chain were mutated. (E) The two sets of mutations for combYSelect1: K409S/T411Y-L368S/D399Y, one of the heterodimers selected for further testing, are highlighted in purple and yellow, respectively. (F) The two sets of mutations for combYSelect2: K409S/T411Y- D399Y/K447S, one of the heterodimers selected for further testing, are highlighted in purple and cyan, respectively.

