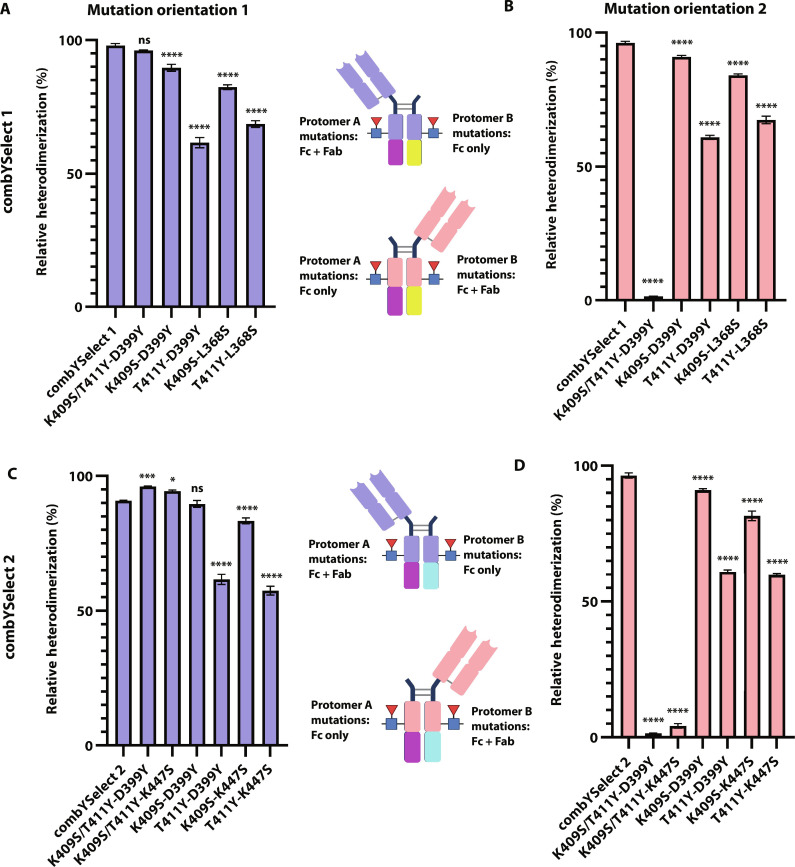
Fig. 5. Mutation controls for combYSelect1 and combYSelect2.
(A and B) Histograms of the relative percentage of heterodimerization as determined by intact LC-MS when some or all protomer A mutations are on the fragment containing a Fab and Fc and protomer B mutations are on the fragment containing only an Fc (A) or when the orientation is reversed (B). (C and D) Histograms of the relative percentage of heterodimerization as determined by intact LC-MS when some or all protomer A mutations are on the fragment containing a Fab and Fc and protomer C mutations are on the fragment containing only an Fc (C) or when the orientation is reversed (D). Statistical significance (n = 3 for each construct) was determined by one-way ANOVA with Dunnett’s multiple-comparison test, in which each mutation control was compared to combYSelect1 or combYSelect2 (ns P > 0.05, *P ≤ 0.05, **P ≤ 0.01, ***P ≤ 0.001, ****P ≤ 0.0001).

