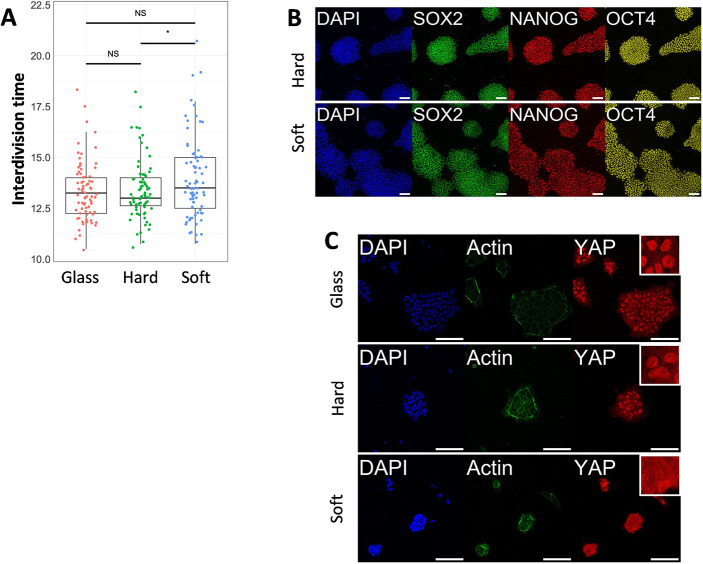
Fig. 2.
Human pluripotent stem cell proliferation and YAP localization. (A) Interdivision time of human pluripotent stem cells (hPSCs) cultured on hard gel, soft gel and conventional glass culture dishes. Dots represent results from individual cells (n=75). The box plot illustrates the interquartile range (from Q1 to Q3) with a median line, while the whiskers extend to the most extreme value that is not labeled as an outlier. (B) Immunofluorescent staining of pluripotent markers in day 6 cells cultured on soft and hard gels. (C) Immunofluorescent staining of YAP in hPSCs cultured on gels and conventional glass dishes. White boxes indicate 40×40 µm area magnifications of YAP staining. Data were obtained from at least three biological replicates. Scale bars: 100 µm. ns, not significant. *P<0.1 (unpaired two-tailed t-test).

