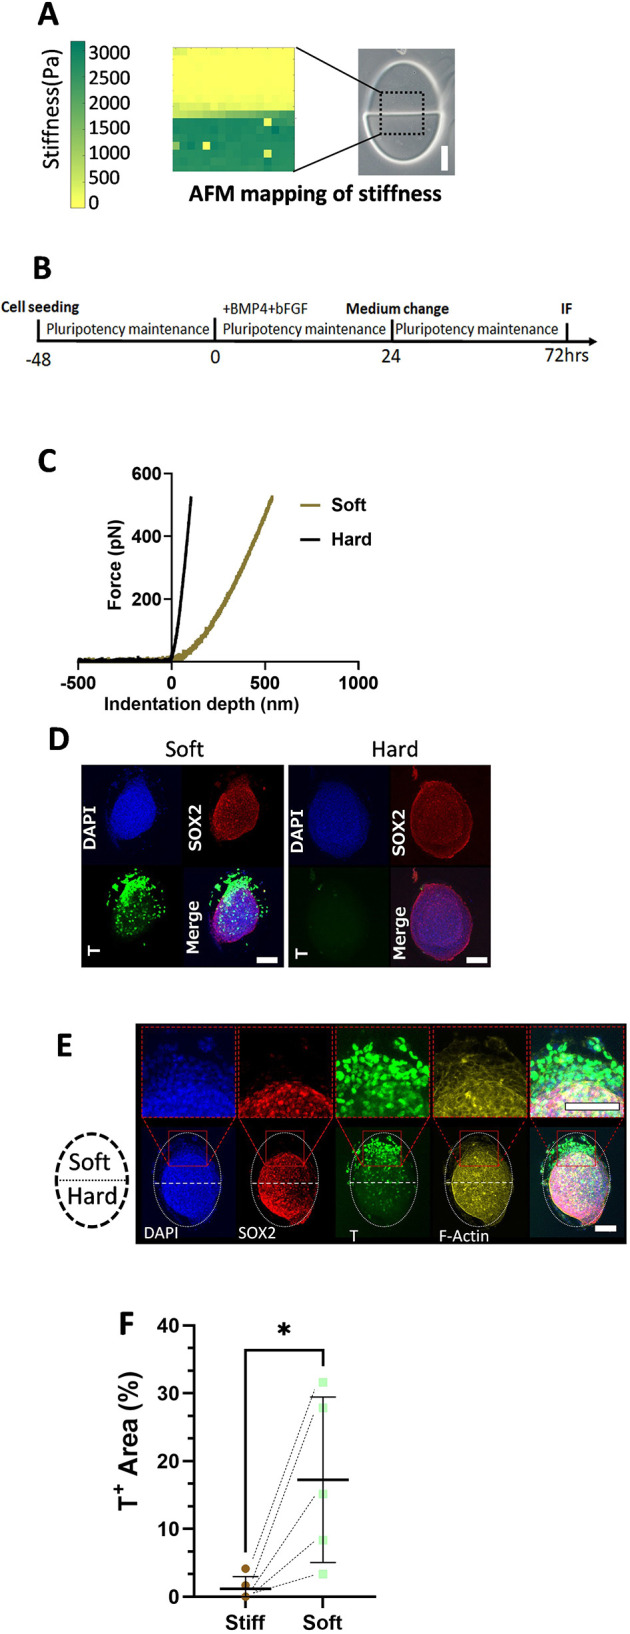
Fig. 5.

Spatial control of hydrogel stiffness and stem cell fate. (A) Presentation of patterned gel and a heatmap illustrating the surface stiffness of the gel measured using an atomic force microscope (AFM). The dotted outline indicates the region of the hydrogel pattern measured. (B) A schematic illustration depicting the differentiation method. (C) Representative AFM force curve data for soft and hard regions. The x-axis represents indentation depth (nm); the y-axis represents force (pN). (D) Immunofluorescent staining of cells differentiated on soft and hard gels using the method shown in C. (E) Immunofluorescent staining of cells differentiated on a partially soft gel using the method shown in C. The white dotted oval outlines the whole gel pattern, with the upper half being soft and the lower half being hard. Red squares contain magnified views of the indicated regions. Scale bars: 100 µm. (F) Quantification of immunofluorescence for cells differentiated on partially soft gel using pulse differentiation. Data are represented by T+ area/gel surface area using maximum projection of immunofluorescent images. Dashed line-connected dots represent soft and hard parts from the same patterned gel. Data were obtained from at least three biological replicates. Black horizontal lines represent median values±s.d. *P<0.05 (one-tailed paired t-test).
