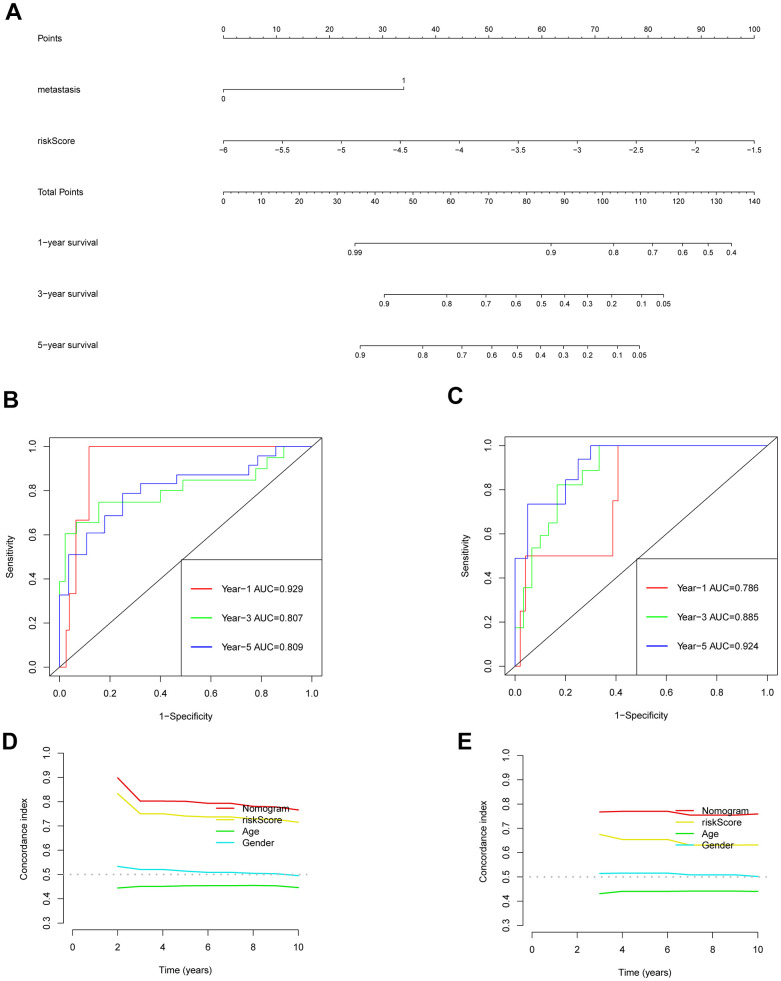
Figure 7.
Validation of the prognostic model nomogram. (A) Nomogram. (B) Time ROC curve of training set. (C) Time ROC curve of the validation set. (D) The C-index calibration curve for age, gender, risk score, and nomogram of the training set. (E) Validate the C-index calibration curve for age, gender, risk score, and nomogram.

