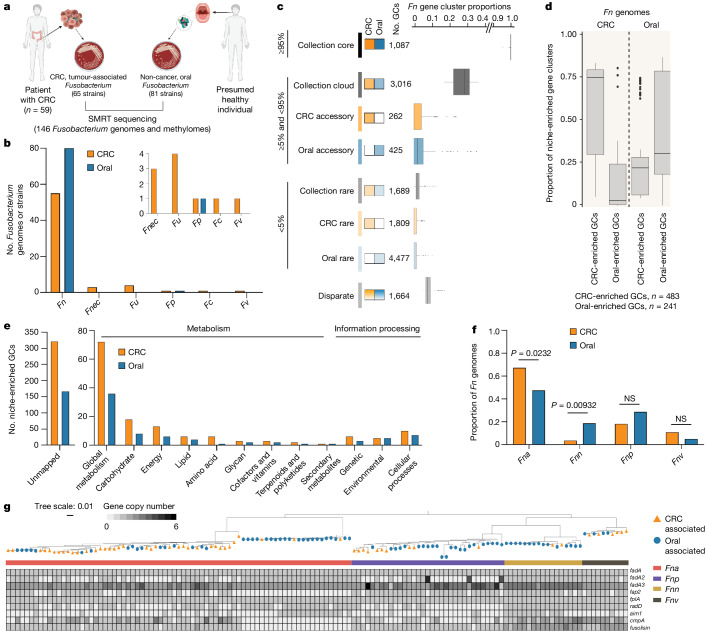
Fig. 1. Fn niche features.
a, A schematic of Fusobacterium strain collection (n = 146) and the sequencing strategy for unique strains. SMRT, single-molecule real-time sequencing. b, A column graph depicting the proportion of Fusobacterium genomes, subset by species, within the CRC (orange) and oral (blue) niches. The inset shows all non-Fn species of Fusobacterium (Fnec, F. necrophorum; Fu, F. ulcerans; Fp, F. pseudoperiodonticum; Fc, F. canifelinum; Fv, F. varium). c, The composition of the Fn pangenome subset by niche. Anvi’o21 gene cluster (GC) prevalence was used to define core (≥95%), accessory (≥5% and <95%) and rare (<5%) features conserved in both CRC-associated and oral-associated strains (collection core, ≥95% in all strains within the collection; collection cloud, ≥5% and <95% in all strains within the collection; collection rare, <5% in all strains within the collection). Disparate features are those that do not fall into any of the other noted bins. d, The proportion of niche-enriched gene clusters across CRC-associated and oral-associated Fn genomes. The plot box shows the 25th percentile, median and 75th percentile. The plot whiskers indicate the minima and maxima. e, KofamKOALA KEGG orthologue analysis27 of niche-enriched gene clusters. f, A column graph depicting the proportion of Fn genomes, grouped by subspecies, within the CRC and oral niche. Statistical analysis was carried out using a two-sample z-test, two-tailed. NS, not significant. g, Gene presence–absence heat map of canonical Fn virulence factors (fadA (refs. 38,39,42), fap2 (ref. 34), fplA (ref. 33), radD (refs. 36,62), aim1 (ref. 35), cmpA (ref. 37) and fusolisin32) across Fn subspecies, in which each column represents an individual genome (Fna n = 75, Fnn n = 17, Fnp n = 33, Fnv n = 10). The heat map is organized using an rpoB gene-based phylogenetic tree. For each genome, the tree end points indicate the niche origin (CRC (orange); oral (blue)) and the bar colour indicates the Fn subspecies (Fna (red); Fnn (gold); Fnp (purple); Fnv (brown)). The graphics in a were created using BioRender.com.

