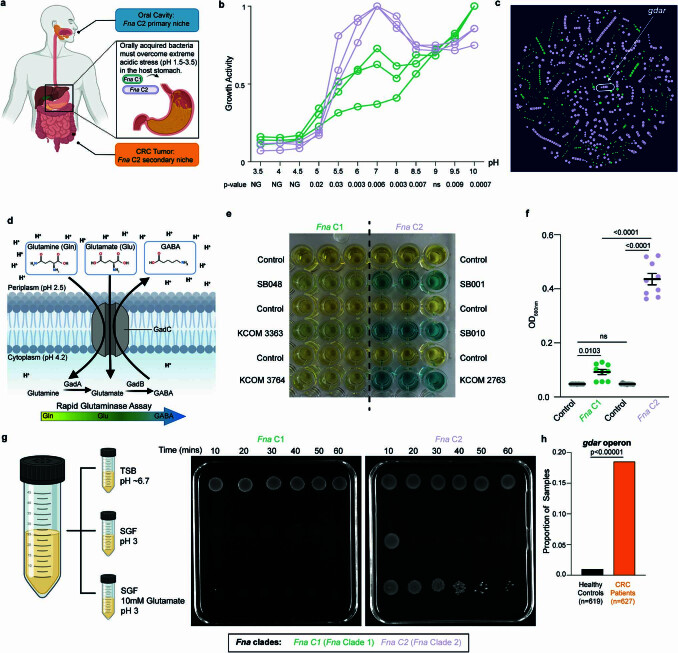
Extended Data Fig. 5. Differences in pH preference and acid resistance across Fna clades.
a, Schematic of potential gastrointestinal route from the oral primary niche to the CRC tumor secondary niche. b, Plot indicates growth activity as measured in Biolog PM10 plates for representative Fna C1 (green) and Fna C2 (lavender) strains. Data is plotted as the normalized average across duplicates. Statistical analysis at each pH performed using Welch’s T-test, two-tailed. NG = no growth. c, PPanGGOLiN51 map of Fna pangenome. Each node represents a gene group, syntenic nodes represent neighboring genes, size indicates relative presence across Fna genomes, and color depicts elements in the Fna C1-associated accessory genome (green), and the Fna C2-associated accessory genome (lavender). White arrow indicates putative glutamate-dependent acid resistance (gdar) operon. d, Schematic depicts mechanism of GDAR acid resistance system. e, Qualitative and f, quantitative measurements of colorimetric assay measuring pH change indicative of conversion of glutamine to glutamate (yellow to green) and conversion of glutamate to γ-aminobutyric acid (GABA) (green to blue) in the presence of representative Fna C1 and Fna C2 strains. n = 3 technical triplicates of 3 biological replicates of 3 strains per Fna clade. Data is plotted as mean ± s.e.m and statistical analysis performed using an ANOVA. g, Schematic of experiment testing the effects of pH stress by exposure to simulated gastric fluid (SGF) at pH 3 or SGF supplemented with 10 mM glutamate at pH 3. Plates show resulting growth for a representative Fna C1 and a representative Fna C2 strain over the course of an hour exposure, as compared to tryptic soy broth (TSB) control at pH ~6.7. h, Bar plots demonstrate the proportion of stool metagenomic samples from patients with CRC (orange) or healthy controls (black) in which a putative gdar operon was detected. Statistical analysis performed using two sample Z test, two-tailed. Cohort sample sizes are indicated at the bottom of each panel. The graphics in a,d,g were created using BioRender.com.

