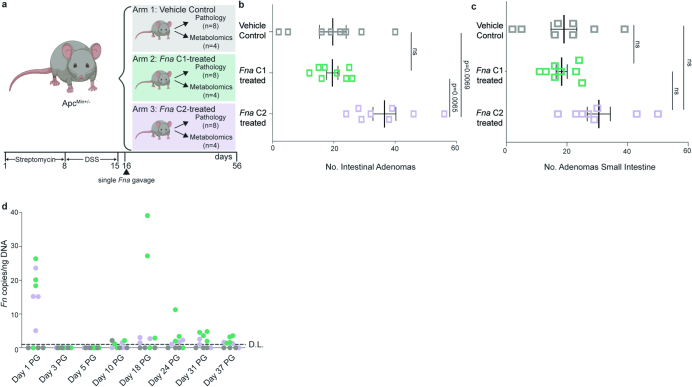
Extended Data Fig. 6. Intestinal adenoma burden and fecal Fusobacterium load in Fna treated mice.
a, Schematic of study with ApcMin+/− mice orally gavaged with vehicle control (Arm 1) or representative Fna C1 (Arm 2) and Fna C2 (Arm 3) strains post streptomycin and dextran sodium sulfate (DSS) to clear the native microbiome and induce colitis, respectively. b-c, Plots indicate the number of adenomas in b, the small and large intestines combined and c, the small intestine by treatment arm, vehicle control (grey), Fna C1-treated (green), or Fna C2-treated (lavender). Data is plotted as mean ± s.e.m; n = 8 mice per treatment arm. Statistical analysis performed using one-way ANOVA. d, Fusobacterium-targeted qPCR was performed on fecal pellets from one-day post-gavage (PG) to study endpoint. Fn presence in each sample is plotted as Fn copies per ng of fecal DNA with a detection limit (D.L.) of 1 Fn copy. Each sample was run in triplicate, and samples with ≥2 duplicates with detectable signal are included. The graphics in a were created using BioRender.com.

