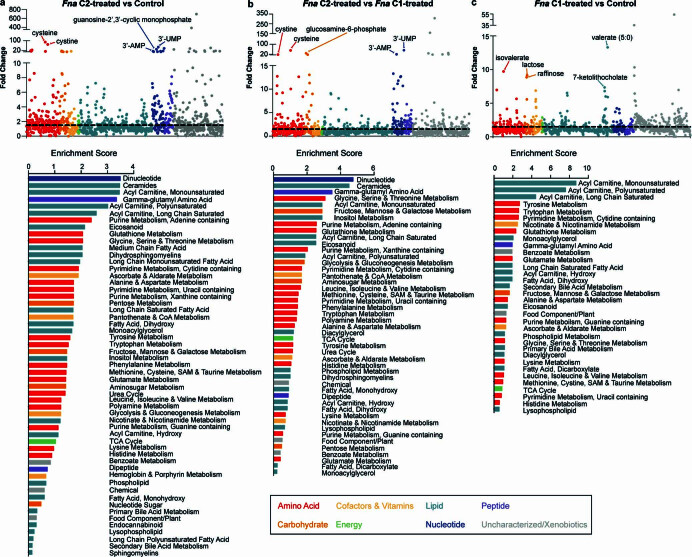
Extended Data Fig. 7. Intestinal metabolite changes in Fna treated mice.
Scatter plots shows fold change for 1,296 detected metabolites from a, Fna C2 treated mice compared to control, b, Fna C2 treated mice compared to Fna C1 treated mice, and c, Fna C1 treated mice compared to control colored by metabolic categorization. Top five characterized metabolites are labeled. Plots below indicate the pathway enrichment score all enriched pathways. Bars are colored by metabolic categorization.

