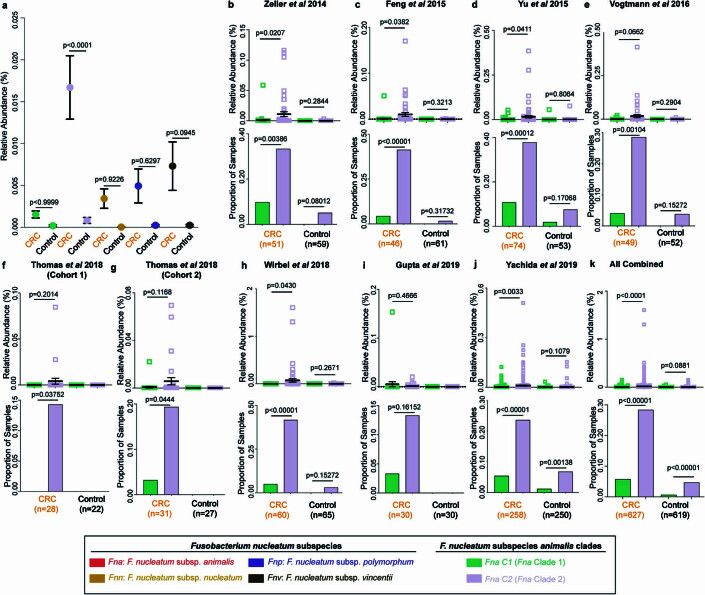
Extended Data Fig. 10. Detection of Fn subspecies and Fna clades in human stool metagenomes.
Detection of a, Fn subspecies (Fnn, Fnv, Fnp) and a-k, Fna clades (Fna C1 and Fna C2) in stool metagenomic data from previously published independent cohorts from patients with CRC and healthy controls. a, Plot shows the percent relative abundance of each Fn subspecies and Fna clade in stool samples from patients with CRC (n = 627) or healthy controls (n = 619). Data is plotted as mean ± s.e.m and statistical analysis performed using a one-way ANOVA. b-k, Samples are plotted both by (b-k) individual cohorts and (k) pooled results. In each panel, top plot shows the percent relative abundances of Fna C1 (green) and Fna C2 (lavender) in each sample. Data is plotted as mean ± s.e.m and statistical analysis performed using Welch’s T-test, paired. Bottom plot demonstrates the proportion of stool samples from patients with CRC and the proportion of stool samples from healthy controls in which Fna C1 and Fna C2 were detected. Data is plotted as mean + s.d. and statistical analysis performed using two sample Z test, two-tailed. Cohort sample sizes are indicated at the bottom of each panel.

