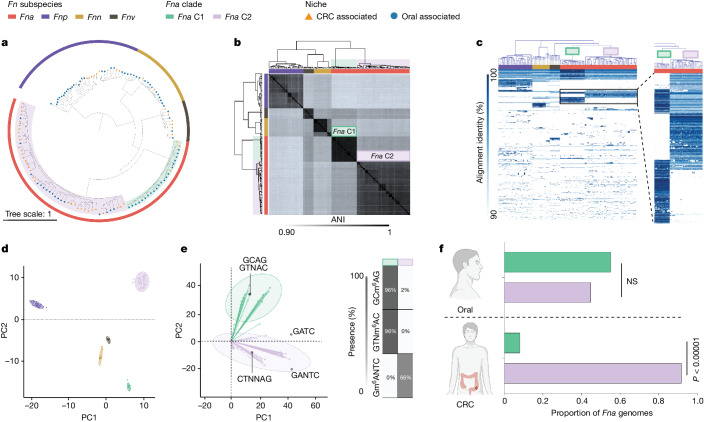
Fig. 2. Genetic and epigenetic characteristics of Fna clades.
a, A kSNP45 maximum-likelihood whole-genome phylogenetic tree. For each Fn genome (n = 135), the tree end points indicate the niche origin (CRC (orange); oral (blue)) and the bar colour indicates the Fn subspecies (Fna (red); Fnn (gold); Fnp (purple); Fnv (brown)). Within Fna, the background colour indicates the Fna clade (Fna C1 (green); Fna C2 (lavender)). b, A clustered dendrogram of the ANI matrix. The bar colour indicates the Fn subspecies (Fna (red); Fnn (gold); Fnp (purple); Fnv (brown)). The Fna clades are highlighted with green and lavender boxes. ANI values are reported in Supplementary Tables 4 and 5. c, A GiG-map visualization of the protein-coding gene content across Fn genomes. The top bar colour indicates the Fn subspecies (Fna (red); Fnn (gold); Fnp (purple); Fnv (brown)) and the box colour indicates the Fna clade (Fna C1 (green); Fna C2 (lavender)). The inset on the right highlights groups of protein-coding genes that are distinct between Fna C1 and Fna C2. An interactive GiG-map dataset is available at https://fredhutch.github.io/fusopangea/. d, PCA of Anvi’o gene clusters by presence and absence in each genome. The colours indicate the Fn subspecies and Fna clades (Fnn (gold); Fnp (purple); Fnv (brown); Fna C1 (green); Fna C2 (lavender)). The ellipses are drawn to 95% confidence. e, Left: PCA of Fna genome-wide methyl-modified nucleotide sequences. The ellipses are drawn to 95% confidence. The overlay of the PCA biplot shows the top five nucleotide motifs that are driving the Fna clade bifurcation. Right: a table indicating the distribution of each motif across the Fna clades. The colour indicates the Fna clade (Fna C1 (green); Fna C2 (lavender)). f, A column graph depicting the proportion of Fna CRC-associated and Fna oral-associated genomes, subset by Fna clade (Fna C1 (green); Fna C2 (lavender)). The statistical analysis was carried out using a two-sample z-test, two-tailed. NS, not significant. The graphics in f were created using BioRender.com.

