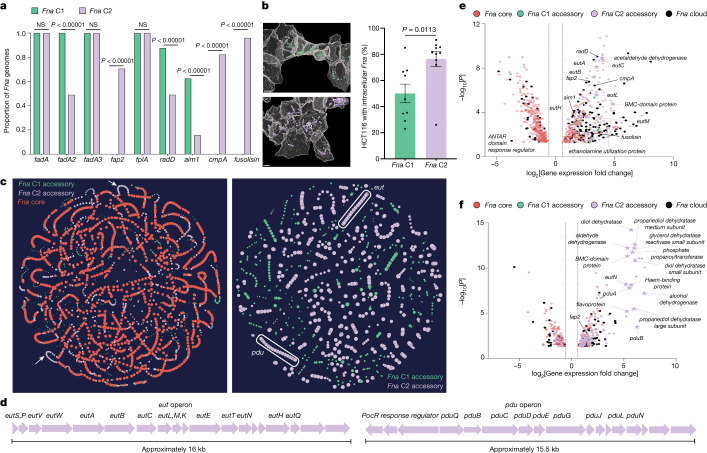
Fig. 3. Inter Fna-clade comparative analyses.
a, A gene presence versus absence column graph depicting the proportion of Fna genomes containing canonical Fn virulence factors, subset by clade (Fna C1 (green); Fna C2 (lavender)). The statistical analysis was carried out using a two-sample z-test, two-tailed. b, Left: computational confocal analysis of colon cancer epithelial cells (HCT116; grey) co-incubated with representative Fna C1 (green) or Fna C2 (lavender) strains. Scale bars, 4 μm. Right: a bar plot demonstrating the percentage of HCT116 cells with intracellular Fna; n = 3 biological replicates with 3 analysed z-stacks. Data are plotted as mean ± s.e.m. The statistical analysis was carried out using Welch’s t-test, two-tailed. c, A PPanGGOLiN51 map of the Fna pangenome. Each node represents a gene group, syntenic nodes represent neighbouring genes, the size indicates relative presence across Fna genomes, and the colour depicts pangenome partition (Fna core (red); Fna C1 accessory genome (green); Fna C2 accessory genome (lavender)). The white arrows (left panel) and oblongs (right panel) indicate Fna C2-associated putative eut and pdu operons. d, Schematics of these Fna C2 operons. An interactive PPanGGOLiN map is available at https://fredhutch.github.io/fusopangea/. e,f, Differentially expressed genes (log2[fold change] ≥ 0.58 and ≤−0.58 with −log10[P value] ≥ 1.30) in a representative Fna C2 strain, SB010, exposed to EA (e) or 1,2-PD (f) compared to unexposed SB010 control. To highlight SB010-unique content, genes also differentially expressed under the same exposure conditions in a representative Fna C1 strain, KCOM 3764, have been removed (Extended Data Fig. 4b,c). The vertical dotted lines indicate the threshold of significant gene expression, defined as log2[fold change] ≥ 0.58 and ≤−0.58. The statistical analysis was carried out using glmQLFTest, two-sided. The data point colours indicate Fna core (red), Fna C1 accessory (green), Fna C2 accessory (lavender) or Fna cloud (black; present in ≥5% and <95% in all Fna strains) genes. The stars indicate eut and pdu operon genes.

