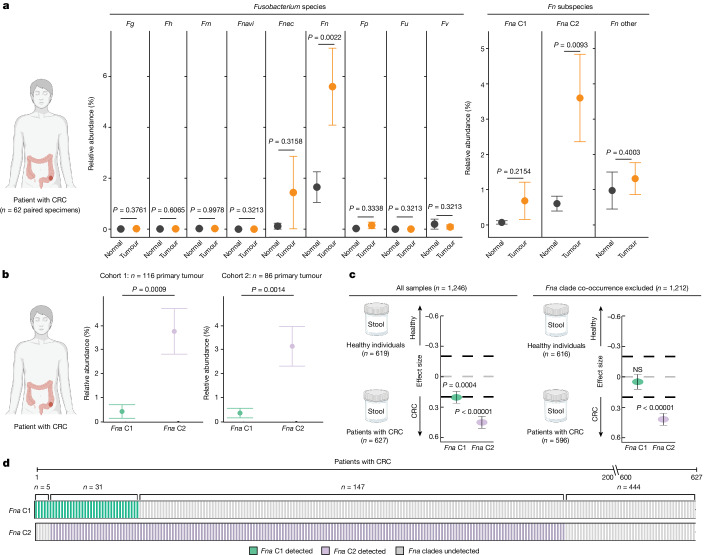
Fig. 5. Fn in human tissue microbiome and stool metagenomic specimens.
a, Plots showing the relative abundance for Fusobacterium species (Fg, F. gonidiaformans; Fh, F. hwasookii; Fm, F. mortiferum; Fnavi, F. naviforme; left plot), and Fn subspecies and Fna clades (right plot) using microbial 16S rRNA gene sequencing of paired tumour (orange) and normal adjacent (black) tissue (n = 62 patients with CRC). Amplicon sequence variants were used to obtain Fna clade resolution (Extended Data Fig. 10 and Supplementary Table 8). The data are plotted as mean ± s.e.m. The statistical analysis was carried out using one-sided t-test, paired. b, Plots showing the relative abundance for Fna C1 (green) and Fna C2 (lavender) within patient primary colorectal tumour tissue from two independent cohorts (cohort 1 (n = 116) this study; cohort 2 (n = 86) BioProject PRJNA362951). The data are plotted as mean ± s.e.m. The statistical analysis was carried out using one-sided t-test, paired. c, Fna C1 and Fna C2 detection in stool metagenomic data from patients with CRC and healthy individuals. The left plot shows the pooled effect sizes for Fna C1 (green) and Fna C2 (lavender) calculated using a meta-analysis of standardized mean differences and a random-effects model on MetaPhlAn4 (ref. 63) species-level genome bin abundances on all CRC samples (n = 627) and samples from healthy individual (n = 619). The right plot shows the effect sizes for Fna C1 and Fna C2 calculated using the same approach, but here samples in which Fna C1 co-occurred with Fna C2 were excluded. The data are plotted as mean ± s.e.m. The statistical significance was assessed by a Wald test, two-sided. All P values are corrected using the Benjamini–Yakuteli method. d, Fna C1 and Fna C2 presence in stool metagenomes of patients with CRC. The bars indicate individual stool samples from patients with CRC (n = 627) and are coloured by Fna C1 and Fna C2 detection (Fna C1 detected (green); Fna C2 detected (lavender); Fna undetected (grey)). The lower brackets indicate the number of stool samples in which Fna C1 occurred independently (n = 5), Fna C2 occurred independently (n = 147), Fna clades co-occurred (n = 31) or Fna clades were not detected (n = 444). The graphics in a–c were created using BioRender.com.

