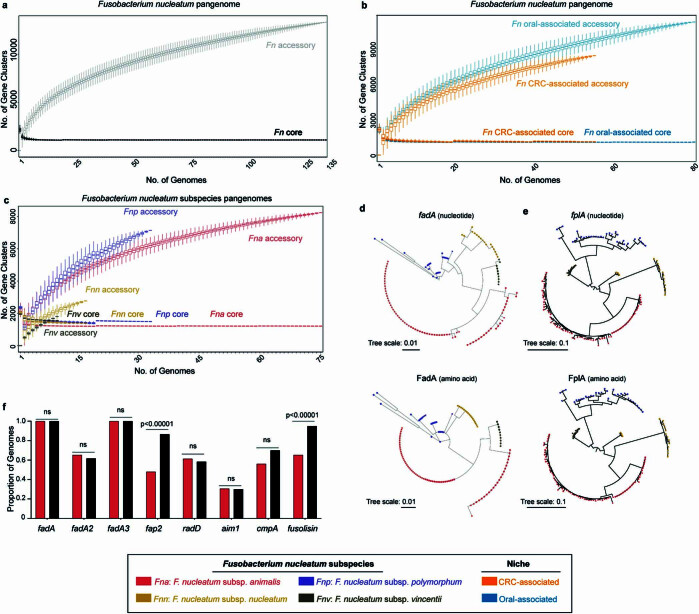
Extended Data Fig. 1. Fn genetic characterization by niche and subspecies.
a, Size of the Fn pangenome split by the core genome (≥95%) (black) and accessory (<95%) genome (grey). n = 10,000 random subsamplings of 135 Fn genomes. Data is plotted as median ± s.d. b, Size of the Fn pangenome split by CRC-associated (orange) and oral-associated (blue) niche origin, with respective core and accessory genomes labeled. n = 10,000 random subsamplings of 55 Fn CRC-associated and 80 Fn oral-associated genomes. Data is plotted as median ± s.d. c, Size of the Fn pangenome split by Fn subspecies, Fna (red), Fnn (gold), Fnp (purple), Fnv (brown), with respective core and accessory genomes labeled. n = 10,000 random subsamplings of 75 Fna, 17 Fnn, 33 Fnp, and 10 Fnv genomes. Data is plotted as median ± s.d. d-e, Maximum-likelihood dendrograms of d, fadA and e, fplA nucleotide and amino acid sequences. For each genome, tree end points indicate Fn subspecies; Fna (red), Fnn (gold), Fnp (purple), Fnv (brown). f, Column graph depicts the proportion of Fn genomes containing canonical Fn virulence factors, subset by Fna (red), non-Fna (black) subspecies. Statistical analysis performed using two sample Z test, two-tailed. NS, not significant.

