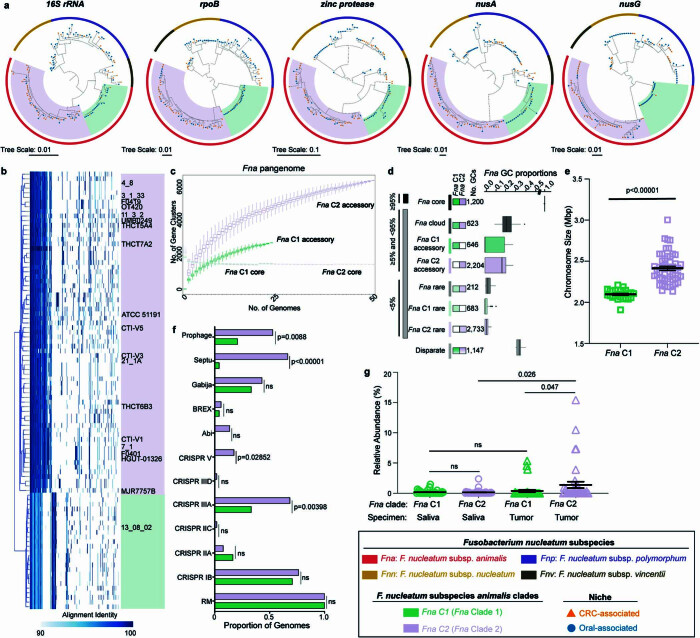
Extended Data Fig. 2. Phylogenetics and genomics of Fna clades.
a, Maximum-likelihood phylogenetic trees of Fn single marker genes, 16 S rRNA, rpoB, zinc protease, nusA and nusG. For each genome (n = 135), tree end points indicate niche origin, CRC (orange) or oral (blue), bar color indicates Fn subspecies (Fna (red), Fnn (gold), Fnp (purple), Fnv (brown)), and background color indicates Fna clades (Fna C1 (green) and Fna C2 (lavender)). b, Genes-in-genomes map (GiG-map) visualization of protein coding gene content across Fna genomes. Boxes highlight Fna clades, Fna C1 (green) and Fna C2 (lavender). Previously published NCBI genomes are labeled by strain name. c, Size of the Fna pangenome split by Fna clade, Fna C1 (green) and Fna C2 (lavender), with respective core and accessory genomes labeled. n = 10,000 random subsamplings of 24 Fna C1 and 51 Fna C2 genomes. Data is plotted as median ± s.d. d, Composition of Fna pangenome subset by clade. Anvi’o gene cluster (GC) prevalence was used to define core (≥95%), accessory (≥5% and <95%), and rare (<5%) features conserved in both Fna C1 and Fna C2 strains (“Fna core” (≥95% in all Fna strains), “Fna cloud” ( ≥ 5% and <95% in all Fna strains), “Fna rare” (<5% in all strains) or unique for strains from each clade. Disparate features are those that do not fall into any of the other noted bins. Plot box shows 25th percentile, median, and 75th percentile. Plot whiskers indicate minima and maxima. e, Column graph indicates chromosome sizes in Fna C1 (n = 24) and Fna C2 (n = 51). Data is plotted as mean ± s.e.m. Statistical analysis performed using Welch’s T-test, two-tailed. f, Column graph depicts the proportion of Fna genomes containing innate bacterial genetic defense systems, subset by Fna clades, Fna C1 (green) and Fna C2 (lavender). Statistical analysis performed using two sample Z test, two-tailed. NS, not significant. g, Graph shows the percent relative abundance of Fna C1 (green) and Fna C2 (lavender) in paired saliva (circle) or tumor biopsy (triangle) samples from 39 patients with colorectal adenocarcinomas47. Data is plotted as mean ± s.e.m. Statistical analysis performed using Welch’s T-test, paired. NS, not significant.

