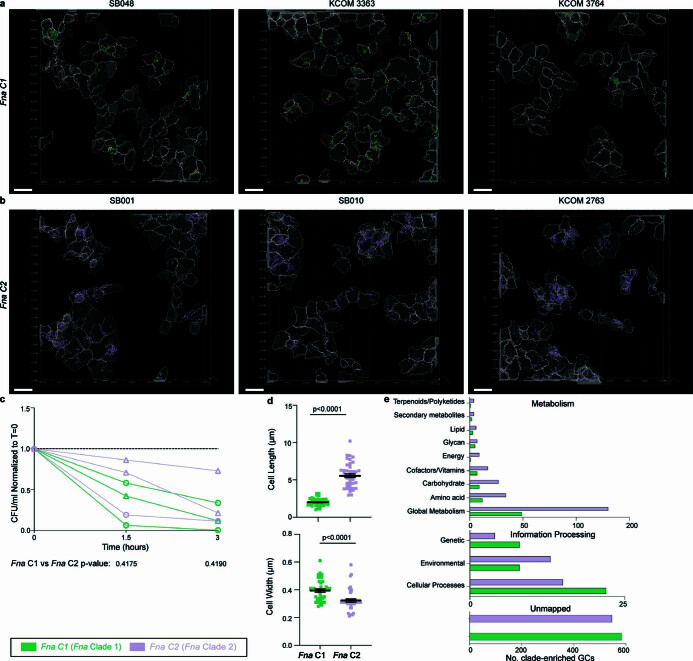
Extended Data Fig. 3. Morphological and genomic differences between Fna clades.
Representative Fna C1 and Fna C2 strains co-cultured with human colon cancer cells (HCT116). a-b, Computational analysis of confocal imaging. Independent masks for cancer epithelial cells (grey), and intracellular bacterial cells (Fna C1 green; Fna C2 lavender) were generated. Masks were used to calculate the percent of HCT116 cells with intracellular Fna (Fig. 3b) (see Methods). Scale bar is 20 μm. c, Bacterial aerotolerance was assessed through serial dilution plating at start, mid-point, and endpoint of co-culture. Graph shows resulting bacterial colony forming units per millilter, standardized to start point for each strain. Dashed line indicates normalization equal to one. Statistical analysis performed using a Welch’s T-test, two-tailed. d, Bar plots indicate Fna cell length and cell width as measured from confocal microscopy images, subset by Fna clades, Fna C1 (green) or Fna C2 (lavender); n = 45 cells per Fna clade. Data is plotted as mean ± s.e.m. Statistical analysis performed using Welch’s T-test, two-tailed. e, KofamKOALA KEGG27 ortholog mapping of Fna clade-enriched gene clusters.

