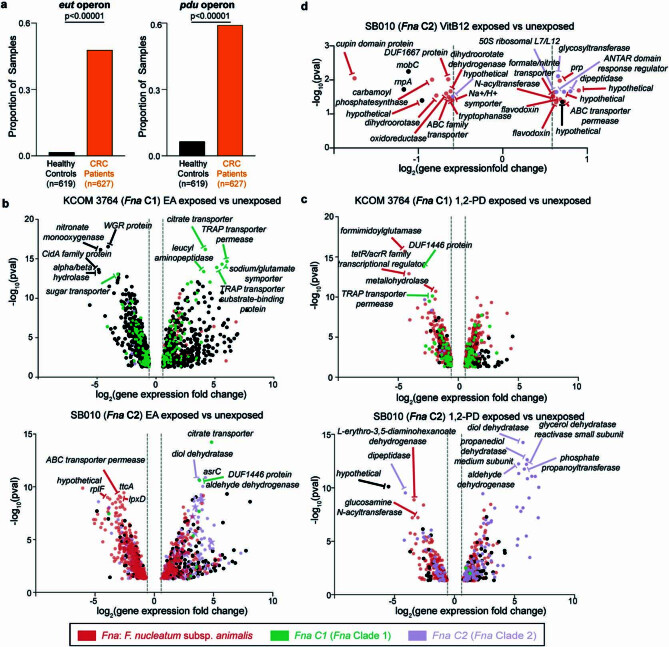
Extended Data Fig. 4. Fna clade transcriptomic responses to intestinal metabolites.
a, Bar plots demonstrate the proportion of stool metagenomic samples from patients with CRC or healthy controls in which putative eut and pdu operons were detected. Statistical analysis performed using two sample Z test, two-tailed. Cohort sample sizes are indicated at the bottom of each panel. b-c, Differentially expressed genes (with log2-transformed fold change ≥ 0.58 and ≤ −0.58 with -log10(p-value) ≥ 1.30) of a representative Fna C1 strain (KCOM 3764) and a representative Fna C2 strain (SB010) under (b) ethanolamine (EA) or (c) 1,2-propanediol (1,2-PD) exposure as compared to their respective unexposed controls. Top five significant (-log10(p-value) ≥ 1.30) upregulated and downregulated genes are labeled. d, Differentally expressed genes (with log2-transformed fold change ≥ 0.58 and ≤ −0.58 with -log10(p-value) ≥ 1.30) in SB010 under Vitamin B12 exposure alone as compared to unexposed control. All differentially expressed genes labeled. For b-d, vertical dotted lines indicate the threshold of significant gene expression, defined as log2-transformed fold change ≥ 0.58 and ≤ −0.58. Statistical analysis performed using glmQLFTest, 2-sided. Data point colors indicate whether a gene is categorized as part of the Fna core genome (red), Fna C1-associated accessory genome (green), or Fna C2-associated accessory genome (lavender) by PPanGGOLiN.

