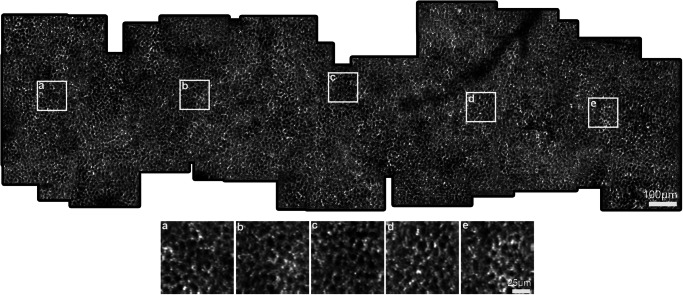
Fig. 4. Parallel discriminator generative adversarial network (P-GAN) enabled wide-scale visualization of the retinal pigment epithelial (RPE) cellular mosaic.
The image shows the visualization of the RPE mosaic using the P-GAN recovered images (this montage was manually constructed from up to 63 overlapping recovered RPE images from the left eye of participant S2). The white squares (a–e) indicate regions that are further magnified for better visualization at retinal locations a 0.3 mm, b 0.8 mm, c 1.3 mm, d 1.7 mm, and e 2.4 mm temporal to the fovea, respectively. Additional examples of montages from two additional participants are shown in Supplementary Fig. 5.

