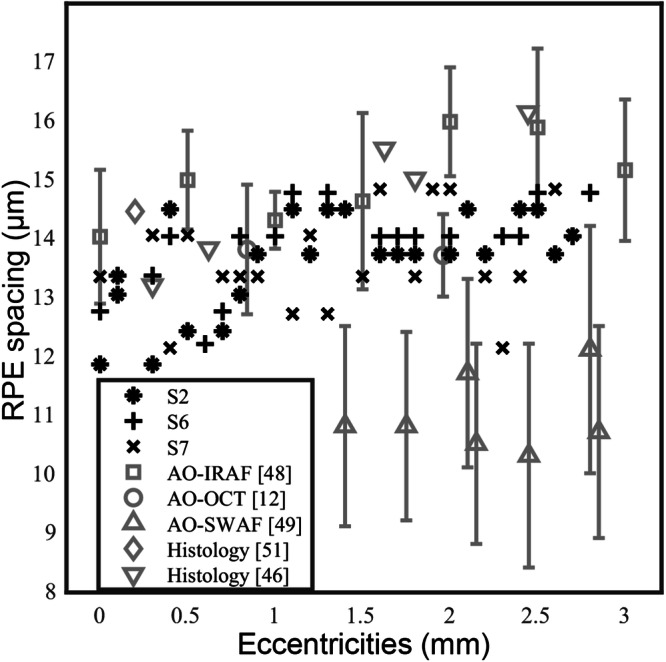
Fig. 5. Comparison of cell spacing of the parallel discriminator generative adversarial network (P-GAN) recovered images with previously published data across retinal locations (eccentricities) temporal to the fovea.

Symbols in black indicate cell spacing estimated from P-GAN recovered images for three participants (S2, S6, and S7) at different retinal locations. For comparison, data in gray denote the mean and standard deviation values from previously published studies (adaptive optics infrared autofluorescence (AO-IRAF)48, adaptive optics optical coherence tomography (AO-OCT)12, adaptive optics with short-wavelength autofluorescence (AO-SWAF)49, and histology46,51).
