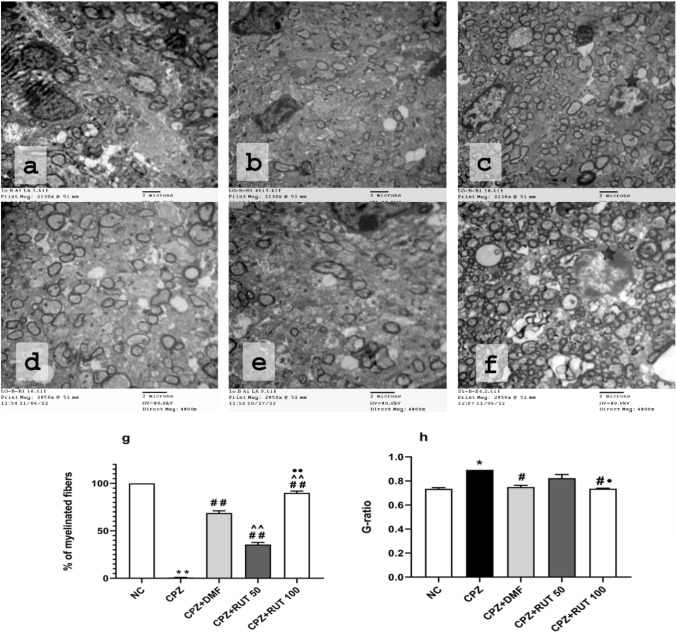
Fig. 6.
Myelination in different treatment protocols. In the DMF group (a, d), remyelination was demonstrated in many nerve fibers. However, in RUT50 (b, e), the myelinated axons were less than those in the DMF group. In RUT100 (c, f), the myelinated axons were more abundant, with a thicker myelin sheath, than both RUT50 and DMF. Oligodendrocyte cells (
 ) were demonstrated frequently in the RUT100 group.
g The percentage of myelinated fibers in the CC in TEM sections.
h Quantification of the G ratio in the CC. Values are expressed as the mean ± SEM. * p < 0.05, ** p < 0.01 vs. NC group, # p < 0.05, ## p < 0.01 vs. CPZ group, ^^ p < 0.01 vs. CPZ + DMF, and • p < 0.05, •• p < 0.01 vs. CPZ + RUT50 (ANOVA). NC: control group fed on normal diet; CPZ: cuprizone group fed on diet enriched with 0.2% (w/w) cuprizone; DMF: dimethyl fumarate 15 mg/kg; RUT50: rutin 50 mg/kg; RUT100: rutin 100 mg/kg; CC: corpus callosum

