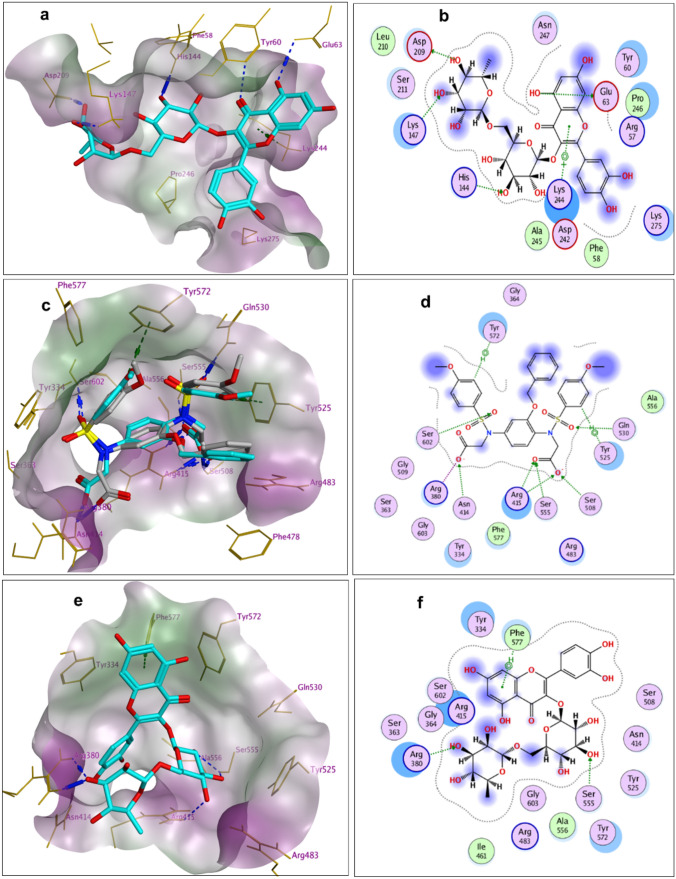
Fig. 8.
3D and 2D docking representations of protein–ligand complexes; a 3D-docked model of RUT (cyan) showing the lipophilicity surface of NF-κB active site; (hydrophilic; green: hydrophobic, purple; neutral; white); b 2D-docked model of RUT within NF-κB active site; c 3D-docked model of redocked ligand (cyan) aligned with the co-crystallized ligand (grey) showing the lipophilicity surface of Keap1 active site for the Kelch domain (hydrophilic; green: hydrophobic, purple; neutral; white); d 2D-docked model of redocked ligand within Keap1 active site for the Kelch domain; e 3D docked model of RUT (cyan) showing the lipophilicity surface of Keap1 active site for the Kelch domain (hydrophilic; green: hydrophobic, purple; neutral; white); f 2D-docked model of RUT within the active site of Keap1 for the Kelch domain

