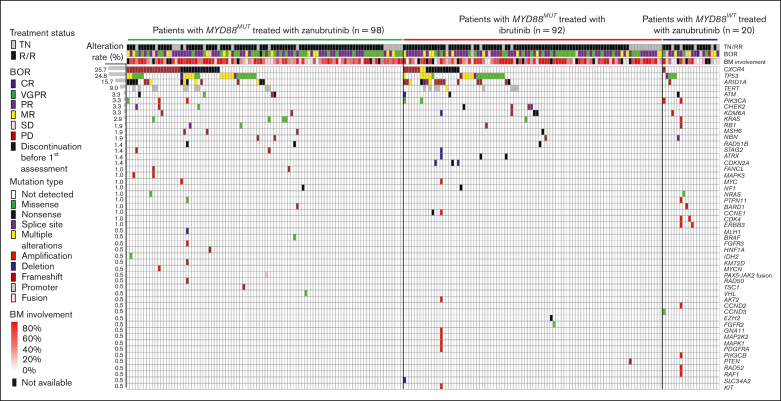
Figure 1.
Baseline genetic alteration landscape in 210 patients with WM treated with BTKis. DNA mutation profile of patients with WM and the distribution of mutations among different study cohorts by mutation type and treatment status (TN and RR). Each column represents 1 patient, and each row represents 1 gene (represented by the gene symbol). Mutation rates of each gene are shown on the left. Mutation type, treatment status, and best overall response are color coded as shown in the figure legend. BM, bone marrow; BOR, best overall response; MR, minor response; PD, progressive disease; RR, relapsed/refractory; SD, stable disease; TN, treatment naïve.

