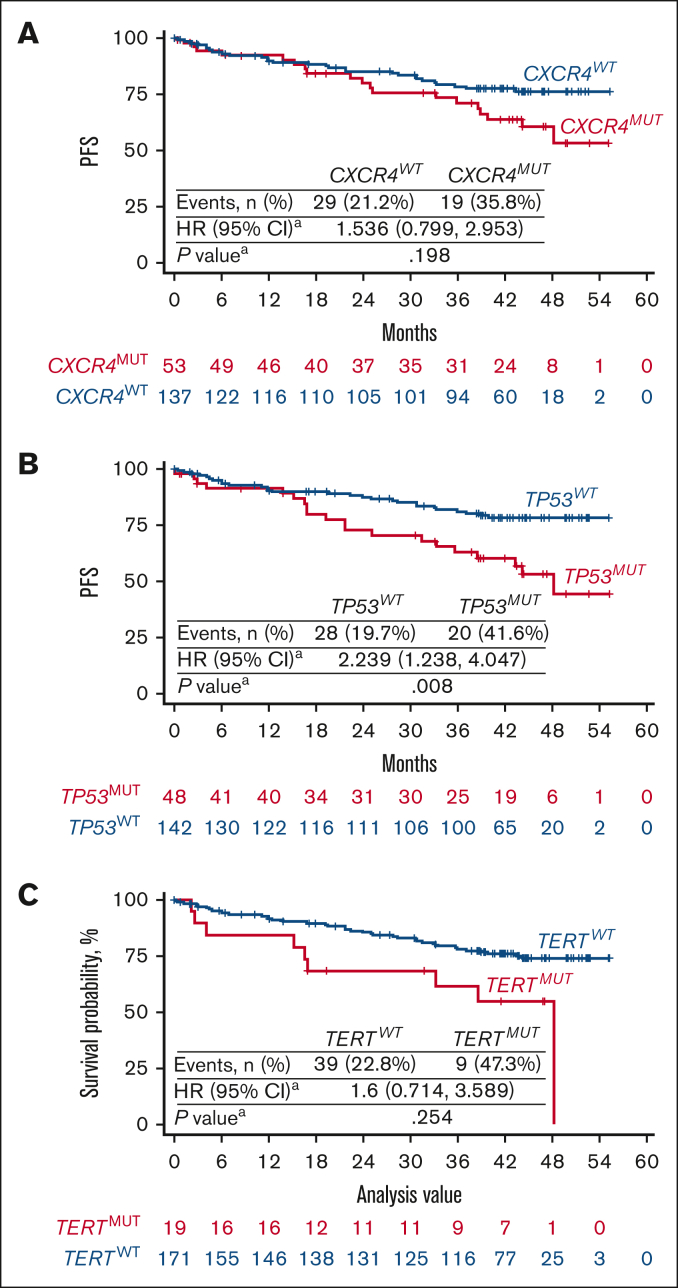
Figure 2.
Kaplan-Meier curves of PFS in patients with WM with MYD88MUT in relation to CXCR4, TP53, and TERT mutational status. Pooled analysis of patients with MYD88MUT, including 98 treated with zanubrutinib and 92 treated with ibrutinib. Kaplan-Meier curves of PFS were presented according to the mutational status of (A) CXCR4, (B) TP53, and (C) TERT. PFS in patients with CXCR4MUT, TP53MUT, and TERTMUT trended toward less favorable outcomes than in patients with the respective WT alleles. HR and P values were estimated using a Cox regression model with CXCR4 (WT and MUT), TP53 (WT and MUT), TERT (WT and MUT) mutational status and treatment arms as covariates. WT is the reference group.

