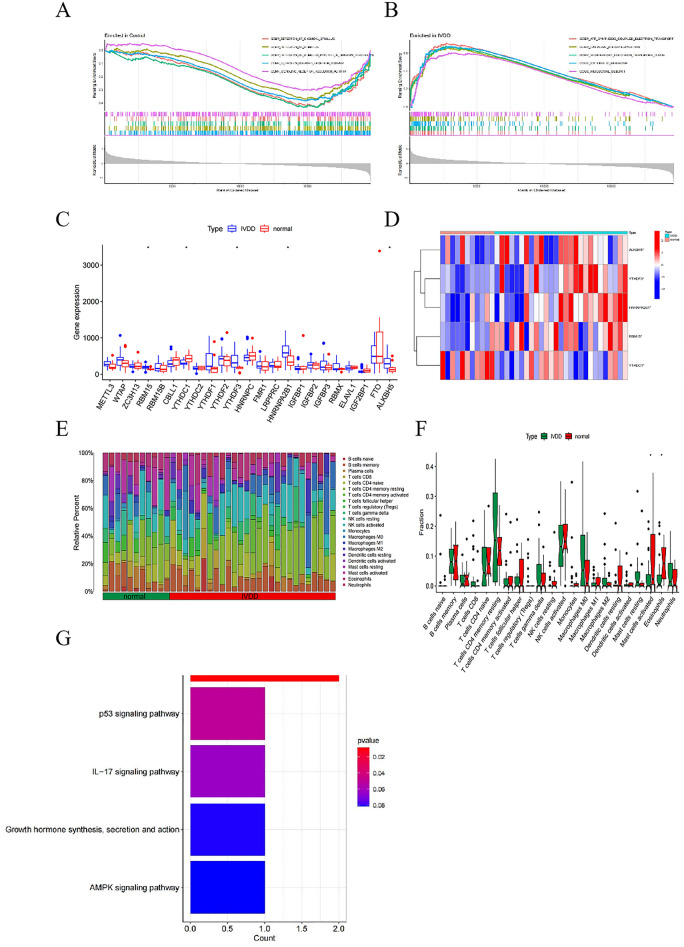
Figure 2.
Differentially expressed m6A genes in IVDD and their immunological characteristics. (A) Results of GSEA analysis of control samples in the training set. (B) Results of GSEA analysis of IVDD samples in the training set. (C) Boxplot of m6A gene expression comparison between Normal and IVDD groups. (D) Heat map of five m6A differentially expressed genes in Normal and IVDD groups. Red represents high expression and blue represents low expression. (E) Content of 22 immune cell species in patients in Normal versus IVDD groups. (F) Differences in the content of 22 immune cells in patients in the Normal versus IVDD groups. *P < 0.05, **P < 0.01, ***P < 0.001. (G) Barplot shows KEGG pathway enrichment results of m6A differentially expressed genes in IVDD.

